 Usman Salis
⬤ XRP has been stuck in a downward trend since early October, but something interesting keeps happening at the same price point. Every time the coin drops to this support zone, buyers step in and push it back up. The daily chart shows multiple bounces from roughly the same area, creating what traders call a "strong low" – a level where demand consistently shows up.
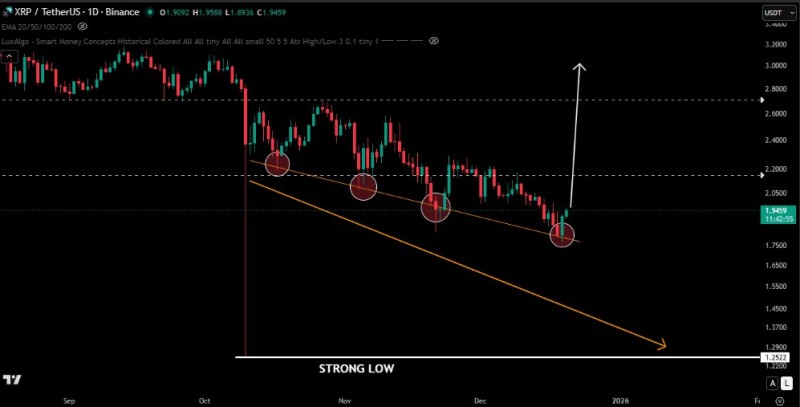
⬤ The price action tells a clear story: XRP has been sliding lower along a downward trendline for weeks now. But here's what matters – sellers keep trying to break through support, and they keep failing. Each attempt to push lower gets met with buying pressure instead of panic selling. The chart marks several of these failed breakdown attempts, all clustering around the same support region. It's a sign that downside momentum might be running out of steam.
⬤ Recent candles show XRP starting to lift off the support area, though it's still early to call this a reversal. The chart identifies $2.20 as the first hurdle buyers need to clear before anyone starts talking about trend changes. Beyond that sits $2.60, a higher resistance zone that could become relevant if momentum really picks up. For now, though, XRP remains trapped below both levels and inside its broader downtrend.
⬤ This pattern matters beyond just XRP. When a major crypto holds support this stubbornly within a downtrend, it can shift market psychology. If sellers can't push through after multiple tries, short-term traders start questioning whether the path of least resistance might actually be up. Whether this strong low eventually leads to a breakout or just postpones more selling remains the question watching the broader digital asset market.
 Usman Salis


