 Peter Smith
⬤ XRP now faces hard technical limits. The weekly chart displays two separate highs that reach the same price before retreating - traders call this a double top. Two equal peaks suggest buyers are losing strength. No final verdict exists - yet bears hold the upper hand. Price keeps failing at a clear ceiling after a strong earlier climb.
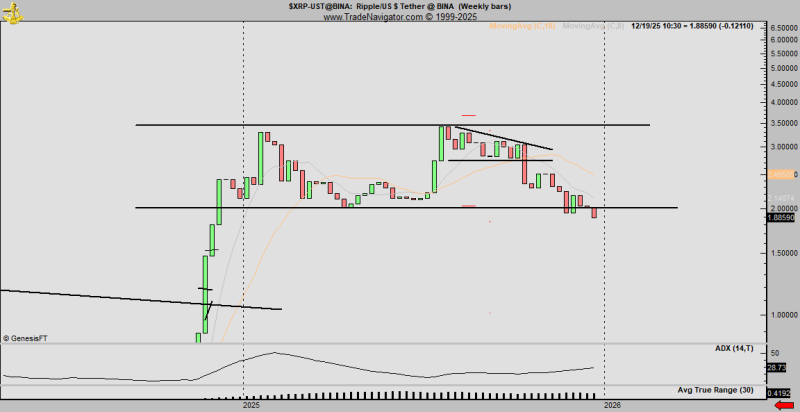
⬤ The chart shows two pronounced highs pressing against the same barrier, followed by a pullback that has lasted for weeks. Once the market slipped back under the upper line, XRP drifted toward the support band between $1.85 and $2.00. That band has caught declines for months. The swing from the twin peaks to the present low points to ebbing momentum rather than a short pause before another leap.
The setup carries bearish implications at current levels, while still allowing for the possibility that the pattern could fail.
⬤ Further indicators echo the guarded tone. Weekly moving averages are leveling off, a sign that the earlier rally's thrust is dissipating. Momentum gauges show little vigor - acceleration is absent. While no collapse has occurred, the double top remains valid until price pushes back above the ceiling.
⬤ The outcome carries weight for the wider crypto market because XRP belongs to the largest and most tracked tokens. Bearish formations on high grade charts like the weekly feed into overall mood, especially after long advances. With XRP wedged between firm resistance overhead and support beneath, the next few weekly closes will decide whether selling persists or the pattern aborts setting short term expectations.
 Peter Smith


