 Saad Ullah
⬤ XRP's price action just hit a technical crossroads. The daily chart is showing a textbook rising wedge pattern after months of upward movement—basically, price keeps grinding higher but within tighter and tighter boundaries. That's typically not a great sign because it means buying pressure is fading even as the price still climbs. As @Steph_IsCrypto pointed out, this setup is raising red flags about a potential sharp drop if support gives way.
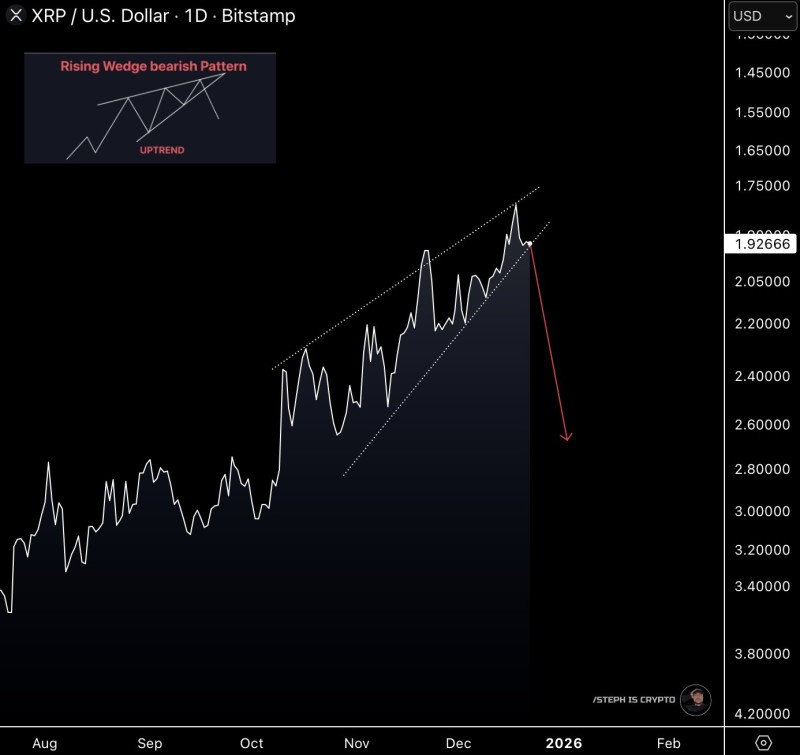
⬤ Right now, XRP is hovering near the $1.90 to $2.00 zone, where momentum has started to stall after multiple attempts to break higher. The rising wedge shows buyers are still in control for now, but that control is weakening. If the lower trendline of this wedge breaks, the chart projects a potential slide down to the $2.60 to $2.80 range—which would be a significant reversal from these recent highs.
⬤ The timing matters here. After months of strong gains across major crypto assets, market conditions around XRP are getting more sensitive. Rising wedges tend to show up when rallies are running out of steam—price is still going up, but the conviction behind those moves is disappearing. The narrowing structure on XRP's chart suggests exactly that kind of exhaustion. A confirmed breakdown below wedge support on the daily timeframe would likely trigger accelerated selling as traders react to the technical breakdown.
⬤ This isn't just chart noise—XRP has a history of moving aggressively when major technical patterns break down. If this rising wedge resolves to the downside, it could ripple across broader crypto market sentiment and reinforce the cautious tone heading into the new year. The current setup is a reminder that technical structure matters, especially when volatility is elevated and momentum starts showing cracks.
 Saad Ullah


