 Eseandre Mordi
⬤ XRP is trading in a tight range between $2.00 and $2.10, stuck between leveraged resistance above and strong support below. The liquidity heatmap shows heavy concentration around $2.10, with significant positioning also building near $2.00. This setup suggests the market is in a liquidity hunt phase, where price pauses as traders position themselves on both sides.
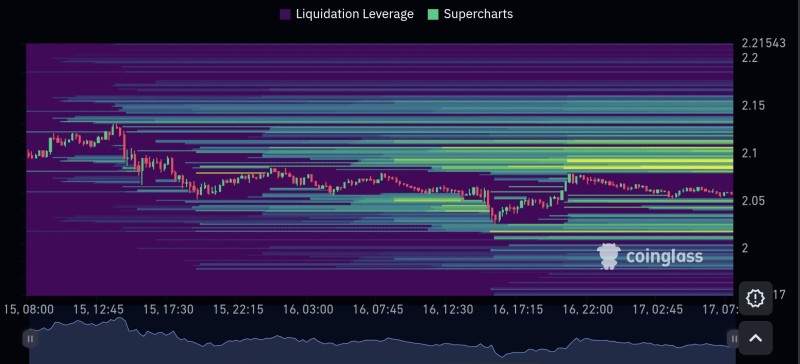
⬤ The $2.10 Level Acts as Major Resistance with clustered stop orders and leveraged positions creating bright horizontal bands on the heatmap. Each time XRP pushes higher, it hits selling pressure in this zone, keeping it capped. Meanwhile, $2.00 serves as a liquidity defense area where previous pullbacks have attracted buyers, preventing deeper drops.
⬤ Price Action Shows Tight Swings without strong directional momentum. The heatmap reveals unevenly distributed liquidity, which typically leads to increased volatility once either side of the range breaks. As leveraged positions pile up near these levels, price often hunts for liquidity to rebalance, potentially triggering sharper moves when consolidation ends.
⬤ This Setup Matters for the broader crypto market because XRP tends to react strongly when liquidity zones get cleared. A breakout from this range could shift sentiment across large-cap altcoins, especially if triggered by cascading stops. Whether price pushes through $2.10 resistance or retests $2.00 support first, resolving this liquidity structure should provide clearer directional signals heading into the new trading week.
 Eseandre Mordi


