 Saad Ullah
Ripple's XRP might be on the verge of one of its biggest moves in years. A new 2-week chart shared by shows a structure that looks strikingly similar to what happened right before XRP's explosive 2017 run—suggesting the token could be gearing up for another major breakout, potentially pushing toward the $10 range.
The Pattern: Then and Now
The chart spans nearly a decade and breaks XRP's price action into repeating phases: accumulation, breakout, and consolidation. According to Cryptollica, XRP's current cycle is showing almost identical traits to its pre-2017 setup—consistent consolidation, stable RSI readings, and a breakout structure forming.
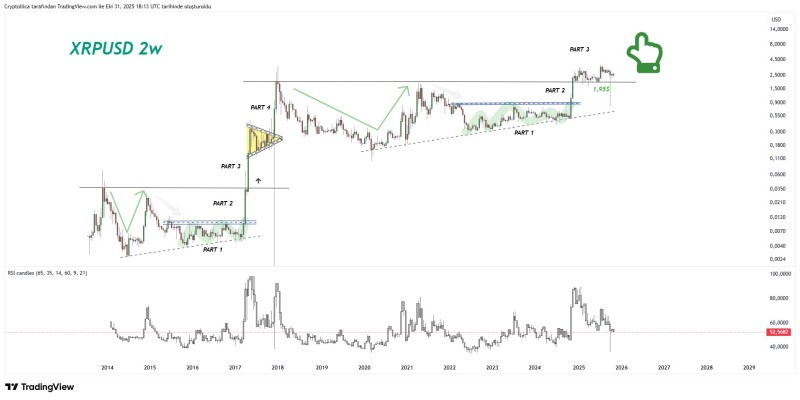
The 2014–2017 Blueprint: XRP's early years followed a clear sequence—extended sideways movement, a tightening range under resistance, a breakout rally that shot XRP from under $0.01 to over $3, and finally a pennant-shaped correction that set up the next expansion.
The Current Setup (2020–2026): The right side of the chart shows a remarkably similar four-part cycle unfolding:
- Part 1 (2020–2022): Multi-year consolidation between $0.20 and $0.50
- Part 2 (2023–2024): Breakout phase, with $1.95 established as new support
- Part 3 (2025–2026): Ongoing coiling formation below long-term resistance around $2.50
- Part 4 (Projected): Expected breakout that could drive XRP toward $10–$14 if the pattern holds
This fractal-based view suggests XRP's consolidation isn't weakness—it's a strategic buildup before the next leg up.
What the Indicators Say
The chart's RSI currently sits near 52.5—a neutral zone that historically precedes strong momentum surges once volume returns. The RSI pattern looks similar to compression phases seen before major moves in 2017 and 2021. If the rhythm continues, a bullish divergence could soon confirm the projected upward move.
Beyond technicals, XRP's broader outlook is improving. Ripple's push into institutional payments, potential U.S. regulatory clarity, and macro catalysts like Bitcoin's halving cycle all support a bullish framework for high-utility tokens like XRP.
Key Levels to Watch
- Support: $1.95—holding above this confirms the structure stays intact
- Resistance: $2.50–$3.00—breaking through here with volume could trigger acceleration
- Target: $10–$14—based on fractal symmetry and Fibonacci extensions from past cycles
If XRP maintains higher lows above $1.95 and clears the $2.50 resistance with solid volume, the path to double digits becomes much more realistic.
The 2-week chart reveals a clear cyclical repetition of XRP's historic breakout pattern. With RSI consolidating, structural symmetry aligning, and support holding firm, the technical setup favors bulls heading into the next phase.
While no one can predict exact timing, the roadmap toward $10+ is backed by consistent long-term behavior. If this pattern plays out, XRP's current consolidation could turn out to be the calm before its biggest storm yet.
 Saad Ullah


