 Saad Ullah
⬤ XRP stays locked in a tight range as technical resistance continues blocking upward moves. The asset faces challenges at Supertrend resistance near $2.13, with price currently stuck below this barrier. The daily chart shows XRP/USD bouncing between roughly $1.88 and $1.93, with recent attempts to push higher fizzling out. While showing some intraday swings, XRP has held above the $1.88 support zone, pointing to consolidation rather than a clear directional break.
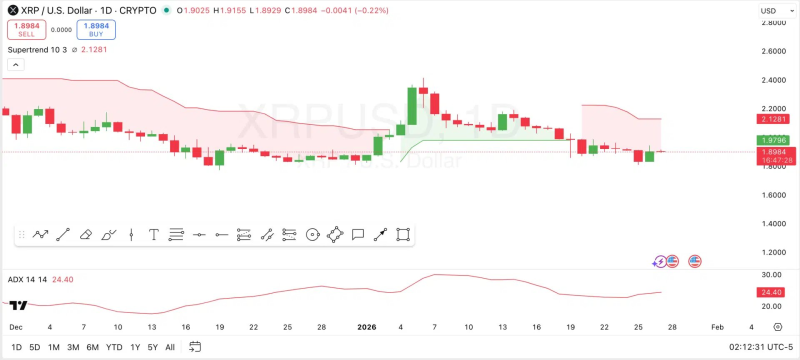
⬤ In the last 24 hours, XRP posted a modest 0.8 percent gain, trading around $1.89 after briefly touching $1.93 earlier in the session. CoinMarketCap data shows 24-hour trading volume above $2.59 billion, down about 19.84 percent, while XRP's market cap sits at $115.41 billion, up roughly 0.98 percent. Looking at longer timeframes, XRP is down 3.6 percent over the past week and 7.8 percent over two weeks, though it's shown a slight 1.1 percent increase over the past month.
The Supertrend indicator positioned at $2.13 continues to define the current bearish trend structure.
⬤ Technical signals reflect ongoing caution. The Supertrend indicator sits above price at around $2.13, suggesting the trend remains bearish. XRP is testing support near $1.89, and its inability to reclaim the Supertrend level shows how hard buyers are finding it to shift momentum. The Average Directional Index reading near 24.40 points to some trend strength, but not enough to signal a solid bullish reversal. This matches the chart structure, where price stays compressed in a defined range.
⬤ The longer-term chart places current action within an extended consolidation following a previous peak near $3.65 in 2025 and the correction that followed. Whether XRP can break above $1.93 and challenge the $2.13 Supertrend resistance remains the key question, as resolving this range will likely shape near-term sentiment and price movement across the broader crypto market.
 Saad Ullah


