 Saad Ullah

⬤ XRP is currently sitting at a major support zone near $1.59 on the daily XRP/USDT chart after sliding through most of late 2025 and into early 2026. The token broke down from a sideways trading range and followed a clear downtrend for months, but recently the decline has started losing steam. Price action is now hugging that lower boundary where momentum seems to be fading.
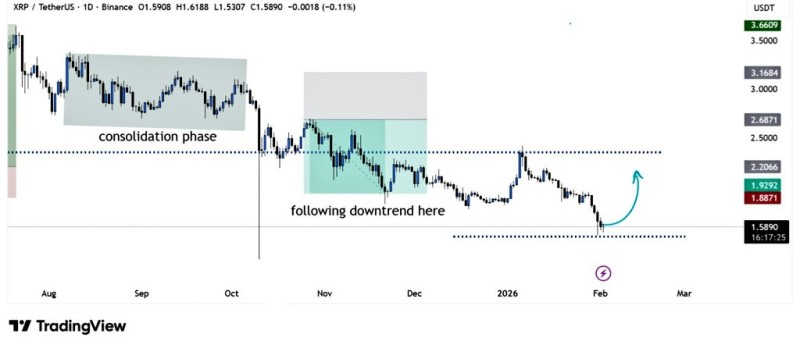
⬤ Looking at the chart structure, XRP spent time consolidating before eventually breaking lower and carving out a series of lower highs and lower lows. The downtrend stayed pretty disciplined, respecting descending resistance throughout the move. But as we got closer to current levels, the selling became less aggressive—recent candles are tighter and aren't pushing down as hard as they were earlier in the trend.
⬤ Right now, XRP is trying to hold just above that support line marked around $1.59. The overall trend is still pointing down, but the fact that selling has slowed suggests we might be shifting from a directional move into more of a consolidation phase. The chart shows this area has acted as a reaction zone before, so there's potential for a short-term bounce—though nothing's guaranteed from here.
⬤ This matters beyond just XRP because support zones like this often set the tone for near-term market behavior, especially after extended selloffs. When a major token stabilizes at a technically important level, it can influence sentiment and volatility across crypto. How XRP behaves here in the coming days could signal whether we're entering a period of sideways action or if the broader downtrend still has more room to run.
 Saad Ullah


