 Saad Ullah
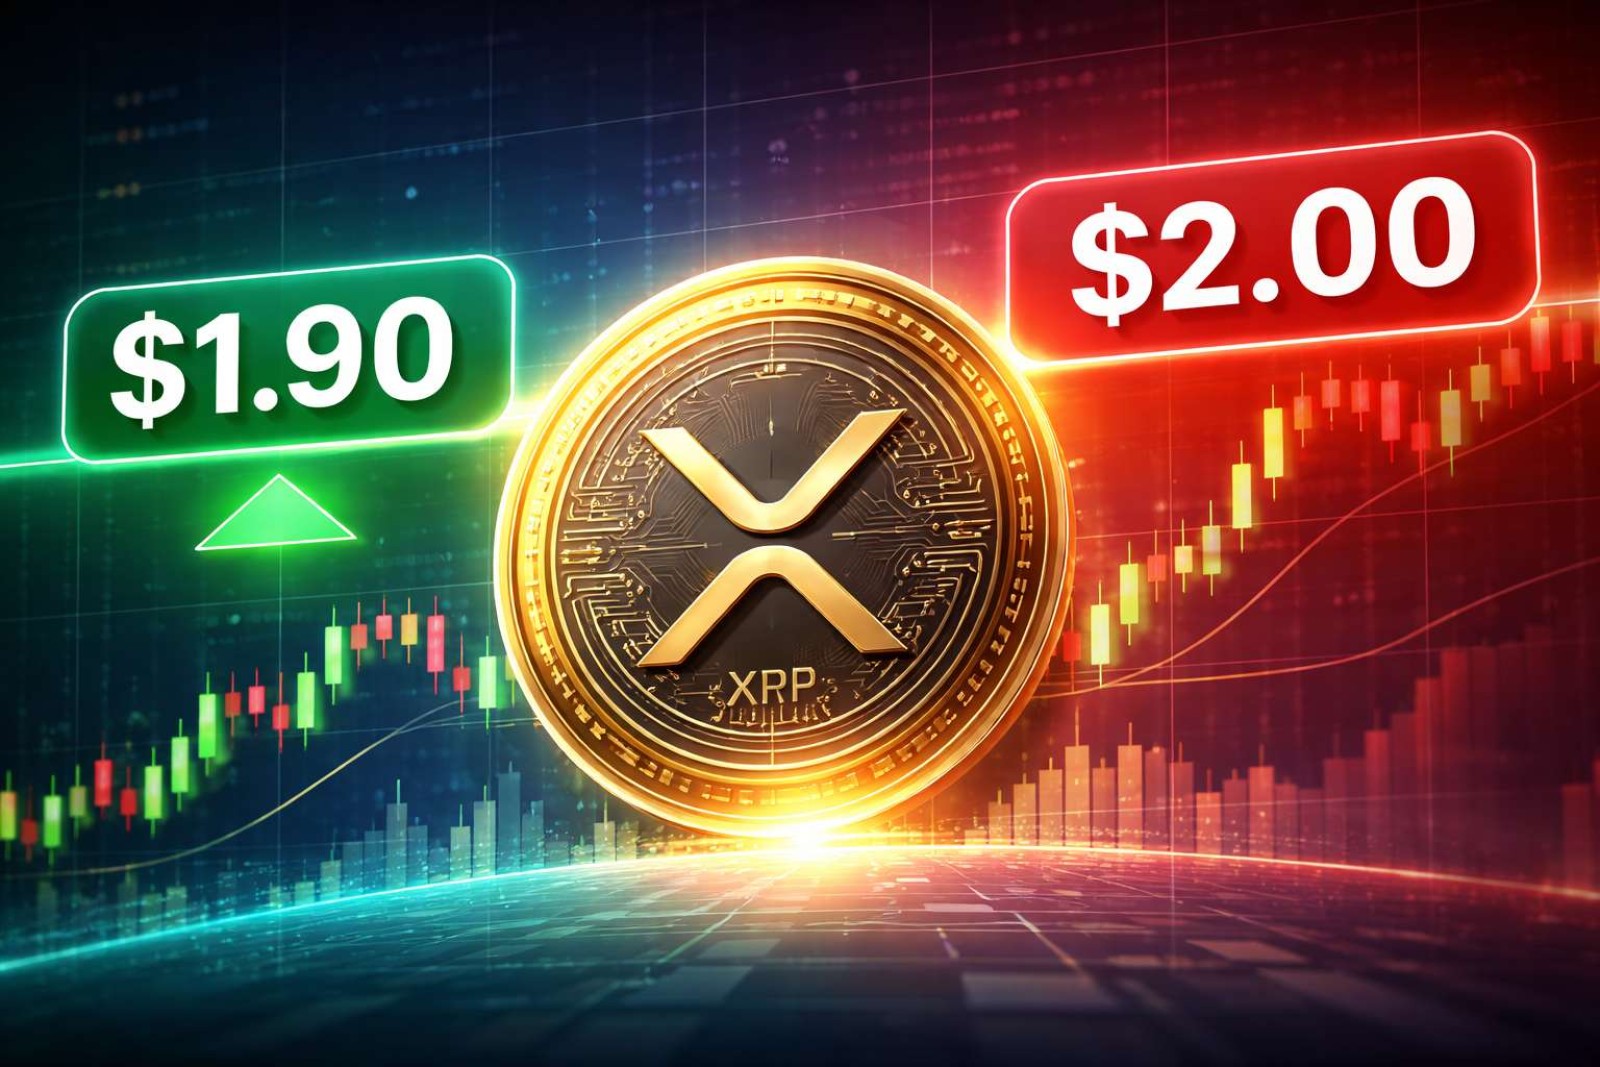
⬤ XRP is consolidating after bouncing cleanly off support near $1.90, right at the Fibonacci 0.5 retracement level on the 4-hour chart. This price action mirrors Bitcoin's recent behavior, suggesting XRP is working through a correction rather than starting a fresh uptrend. Buyers stepped in at this technical level, creating a temporary floor after the recent pullback.
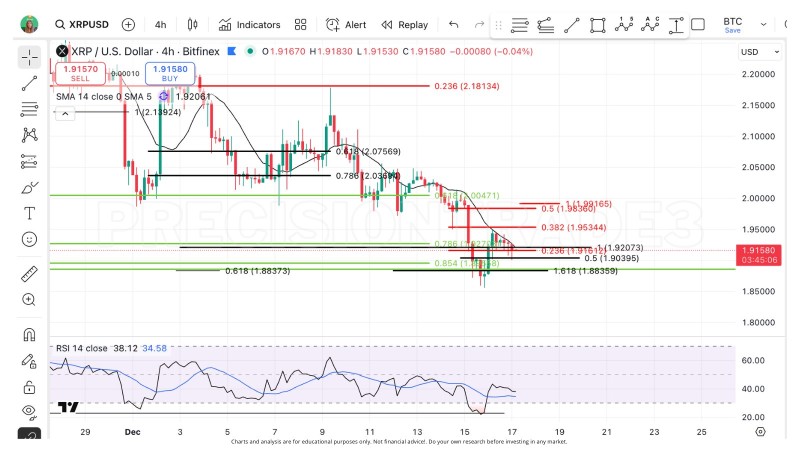
⬤ The chart shows XRP previously pushed into resistance between $1.95 and $1.98 before sellers knocked it back down. Now it's trading around $1.91 to $1.92, sitting just above layered support that includes the $1.90 Fibonacci level and deeper backing near $1.88. Short-term moving averages are still pointing down, which means bearish pressure has cooled but hasn't completely flipped yet.
⬤ Momentum readings back this up. The RSI is hovering in the mid-30s to low-40s—not oversold, but definitely showing weak momentum. This suggests XRP might need more time to build energy or test support again before making a real push higher. The big test ahead is the $2 resistance zone, where sellers have shown up before and could easily step in again.
⬤ XRP's price structure matters because it often reflects broader sentiment across major altcoins. How it reacts at these Fibonacci levels—especially between $1.88 support and $2 resistance—will likely signal where momentum is heading next as we move deeper into early 2025.
 Saad Ullah


