 Alex Dudov
⬤ XRP's weekly chart shows a clear falling wedge pattern that's been forming since the token peaked above $3.00. The price has been squeezed into a tighter range, now sitting around $1.86 near the pattern's lower edge. Both the highs and lows have been declining for months, creating the classic converging trendlines that define this technical setup. The narrowing price action suggests the market is coiling up for something bigger.
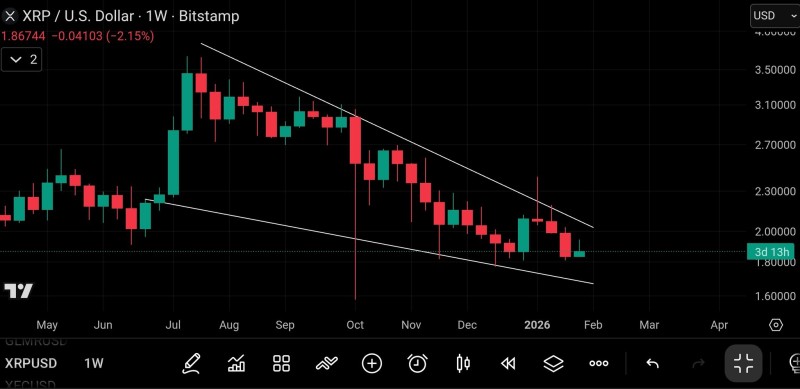
⬤ Recent weekly candles reveal smaller price swings and calmer trading conditions, which usually means sellers are losing steam. The chart shows XRP approaching the point where the two descending trendlines meet—the spot where these patterns typically break one way or another. Right now, price is hovering between $1.80 and $1.90, stuck in this compressed zone as the market decides its next direction.
⬤ Falling wedges have a reputation for leading to upside breakouts when price finally punches through the upper trendline. XRP hasn't broken out yet, but the technical foundation is there. If price manages to clear resistance convincingly, it could flip the entire market structure and open the door to much higher levels. Until that happens though, XRP remains trapped inside this wedge without a clear trend.
⬤ What happens next with XRP matters beyond just this one token. The asset has shown a pattern of explosive moves after long periods of tight consolidation, and a genuine breakout here could light a fire under other major altcoins. On the flip side, if resistance holds and price gets rejected again, we're likely looking at more sideways grinding. The next few weeks should tell us whether XRP breaks free or stays stuck in neutral.
 Alex Dudov


