Eseandre Mordi

XRP is approaching a technically critical moment as price tightens within a descending wedge formation. As JD noted, the setup includes a potential bullish divergence with a breakout dependent on volume confirmation. The chart suggests that the current structure is nearing resolution, with both upside and downside scenarios clearly defined.
The XRP Pattern Driving the Setup
The chart shows XRP moving within a falling wedge, defined by converging downward-sloping resistance and support lines. This structure follows a prior sharp rally, after which price entered a corrective phase. The key feature is compression - price continues to print lower highs and lower lows within the wedge, but the range is narrowing. This type of formation is commonly associated with weakening selling pressure as the pattern matures.
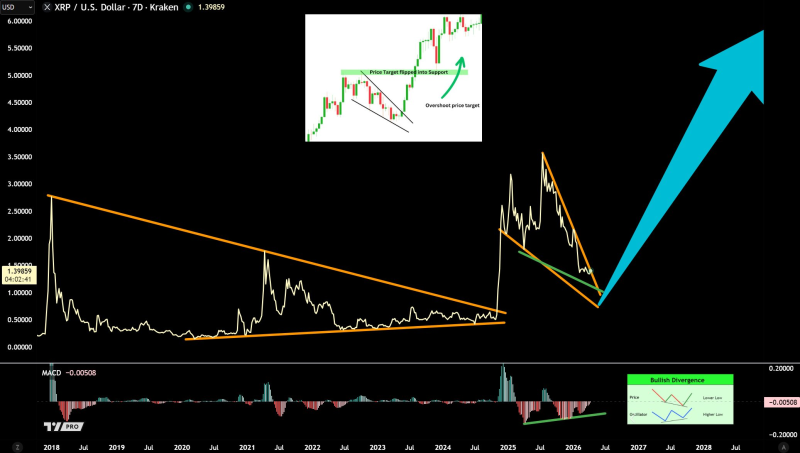
At this stage, the wedge remains intact and no breakout has been confirmed. XRP price analysis signals volatility ahead captured a prior compression phase in XRP that developed similar characteristics - showing how prolonged tightening within a defined structure has historically preceded significant directional moves in either direction.
XRP Momentum Starts to Shift Beneath Price
While price action continues to drift lower, the indicator structure on the chart points to a potential bullish divergence. Momentum is forming higher lows while price is still making lower lows - suggesting that downside pressure is fading even as price hasn't confirmed it yet.
In technical analysis terms, divergence alone does not confirm a reversal. But combined with a compressing structure like a falling wedge, it increases the probability of a breakout attempt and changes how the setup should be weighted.
The Two XRP Scenarios the Chart Defines
The setup is clearly conditional, with two distinct paths outlined on the chart:
- A breakout above the wedge, especially with volume, opens the path toward the projected upside targets in the green box
- A move lower toward the pink box represents the alternative scenario, where price could find a new accumulation zone before any recovery
This binary structure reflects a typical late-stage compression phase. The longer price remains inside the wedge, the more pressure builds for a decisive move in either direction.
Ripple price prediction points to major breakout outlines the extended upside scenario that becomes relevant if the wedge resolves to the upside with volume - placing the current setup within a much longer compression cycle that has been building across multiple timeframes. XRP technical setup highlights key accumulation zone maps the downside accumulation scenario, showing where price would likely find structural support if the wedge breaks lower rather than higher.
 Eseandre Mordi