 Usman Salis
⬤ Solana has hit a key technical level on the weekly chart, currently testing the $110 support zone. This area marks a critical decision point where holding support could maintain the current structure, while a break below would open the door to much lower prices. The chart shows this zone has been tested multiple times historically.
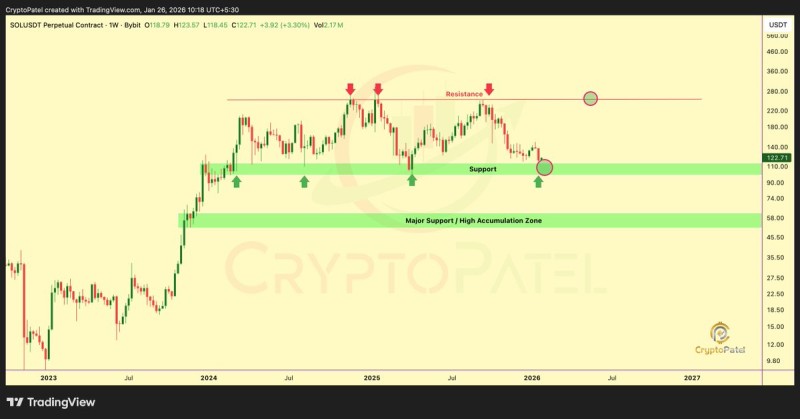
⬤ The chart reveals SOL repeatedly getting rejected at long-term resistance around $200–$220, with multiple failed attempts to break through. These rejections show strong selling pressure overhead, preventing buyers from pushing price above this ceiling. After each failed attempt, price has rotated back down toward mid-range support.
⬤ The $110 level is clearly marked as important support, with several previous bounces confirming its significance. According to the analyst, "This area represents a critical decision point for SOL." If $110 breaks, the next major support sits between $70 and $50—a zone that previously acted as an accumulation base during earlier consolidation. However, if $110 holds, the broader range stays intact and keeps higher levels in play.
⬤ This moment matters for the wider market because Solana is one of the most actively traded major cryptocurrencies. How price reacts at $110 will likely influence sentiment across altcoins. With SOL caught between resistance above and critical support below, its next move should provide a clear signal for the weeks ahead.
 Usman Salis


