 Marina Lyubimova
⬤ Solana's currently hanging around the lower end of its trading range on the 4-hour chart, sitting near $122–$124. This zone has worked as a support level before within the current sideways pattern. After getting rejected from the mid-$140s recently, SOL drifted back down to this area, though the selling hasn't really picked up steam—suggesting buyers might start showing interest here.
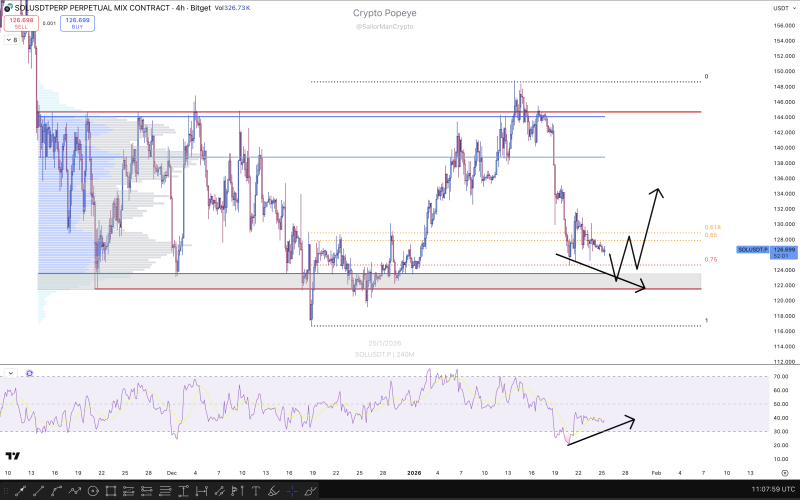
⬤ The bigger picture shows SOL stuck in a wide range for quite a while now. While the recent drop from resistance looks bearish at first glance, there's no panic selling happening. Price is just rotating back to the lower boundary where it's found support multiple times before. The question now is whether this level holds again or if we see a breakdown below it.
⬤ What makes this interesting is the RSI divergence forming on the 4-hour timeframe. While price keeps making lower lows, momentum indicators are stabilizing—a pattern that's previously led to short-term bounces from this level. That said, there's plenty of overhead resistance to deal with, so even if SOL bounces here, it'll need to break through multiple barriers before any real upside develops.
⬤ Value area lows like this tend to be decision points in sideways markets. If SOL defends this $122-$124 zone, we're probably staying range-bound for longer. If it breaks down, it could signal acceptance at lower prices and a shift in market structure. Either way, the next few sessions should tell us whether this range stays intact or starts falling apart.
 Marina Lyubimova


