Saad Ullah
⬤ Solana is pushing toward a critical resistance level near $88 after bouncing from lower support on the hourly chart. The market could attempt a quick spike into this zone before picking its next direction. SOL was last trading around $86-$87, gradually climbing from the range floor.
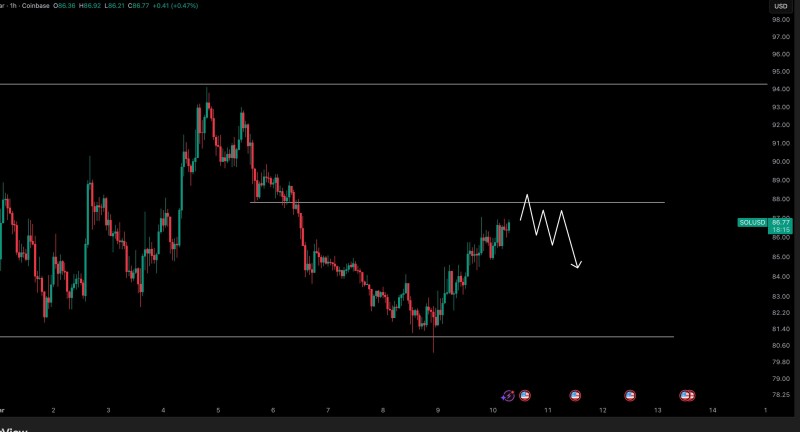
⬤ The chart reveals a defined range between roughly $81 support and $88 resistance. After sliding from higher levels, SOL stabilized near the bottom of this band and has been grinding back toward the top. Buyers are once again testing the upper liquidity area where sellers previously stepped in, as detailed in Solana Tests Critical $90 Resistance Zone Before Potential Breakout, which flagged the $88-$90 corridor as a key barrier for any bullish continuation.
The market could attempt a quick spike into the $88 zone before determining its next direction.
⬤ How SOL reacts at $88 will likely set the tone for what comes next. A spike into resistance that fails to hold points to a pullback toward the mid-range or lower boundary - a pattern well-documented in Solana Trading Near $76 Support, $90 Range Resistance, where repeated rejections kept price oscillating inside the band.
⬤ The alternative scenario has SOL reclaiming and holding above $88. In that case, momentum could accelerate toward a broader recovery. Solana Holds $86-$91 Support as Uptrend Structure Persists showed how clearing resistance shifts short-term structure from neutral to bullish.
⬤ Range boundaries like $88 naturally attract liquidity and heavier trading activity - making SOL's reaction here a meaningful signal for near-term volatility across the broader crypto market. Whether this becomes a breakout or another rejection, the $81-$88 band remains the defining technical story for SOL right now.
 Saad Ullah