 Saad Ullah

⬤ Solana is trading sideways after bouncing hard from recent lows, with the price now settling into a well-defined range on the 4-hour chart. The chart shows SOL recovering from the bottom of this range and now hanging out near the middle, suggesting the market is taking a breather after some wild price swings. Traders are watching to see if momentum can build from here.
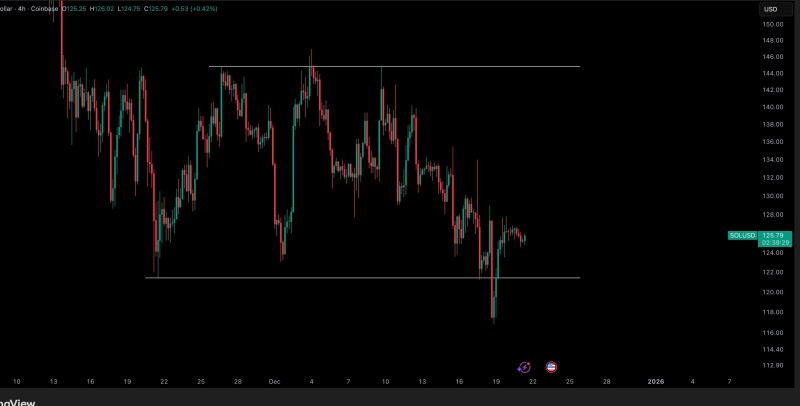
⬤ On the upside, there's a horizontal resistance zone near the top of the range where multiple rallies have hit a wall before. This level keeps acting as a ceiling where sellers show up, blocking further gains. Until SOL can push through this zone with real strength behind it, any upward movement faces a tough barrier.
⬤ On the downside, the bottom of the range has been holding up as solid support. The recent bounce started right from this level, where buying pressure kicked in and pushed price sharply higher. Since then, SOL has stayed above this support, which lowers the immediate risk of another drop and confirms this zone matters for the short-term structure.
⬤ This consolidation phase matters because tight ranges like this often come right before bigger price moves. A clean break above resistance or below support could flip short-term sentiment and ripple across related crypto assets. For now, Solana remains rangebound, respecting both the support and resistance levels clearly marked on the chart.
 Saad Ullah


