 Marina Lyubimova

⬤ Solana's testing a critical price zone right now as traders watch whether this short-term bounce has legs. Technical analysis shows SOL ideally heading toward $131.57 in wave (A). The chart reveals price climbing back from recent lows, trying to build momentum after getting hit with a sharp correction.
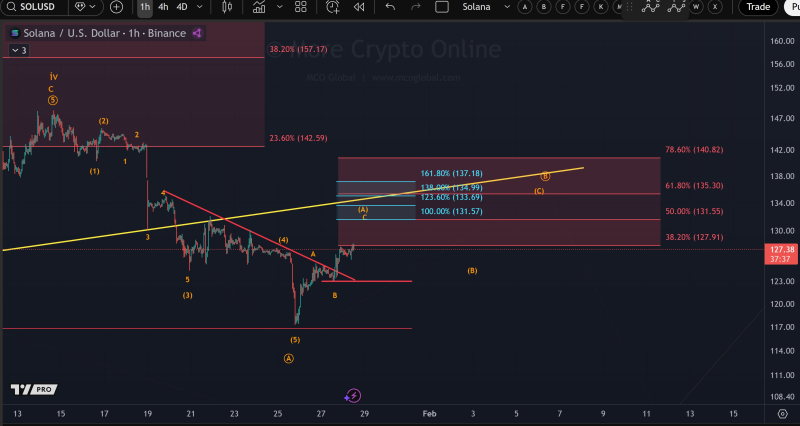
⬤ The $131.57 area stands out as the wave (A) target on the chart. This level lines up with the 100% Fibonacci retracement and sits just under a bigger resistance zone. SOL's still trading below a downward trendline though, which means this move looks more like a correction than a full trend flip.
⬤ There's a clear danger zone marked at $123. If price breaks below that red line, it signals wave (B) has started and the current recovery attempt is done. The chart makes it pretty obvious—holding above $123 is make or break for this bounce to keep going. Losing that support would send focus back to those lower price levels we saw during the last drop.
⬤ This setup matters because it draws a clear line between continuation and another leg down. With SOL trading between $123 and $131.57, price is stuck in a tight range where the next move depends entirely on whether support holds. Since Solana's sitting at this turning point, how it behaves in the next sessions could influence sentiment across the wider altcoin market as everyone watches whether this correction resolves upward or transitions into wave (B).
 Marina Lyubimova


