 Usman Salis

⬤ Solana just flipped bullish after pushing through the $144.63 resistance on the daily chart. This breakout marks a real shift in momentum after weeks of choppy price action. The token had been stuck in a range between $119.54 and $144.63, testing support multiple times without breaking lower. Now that SOL has reclaimed this level and is holding above it, the technical picture looks completely different.
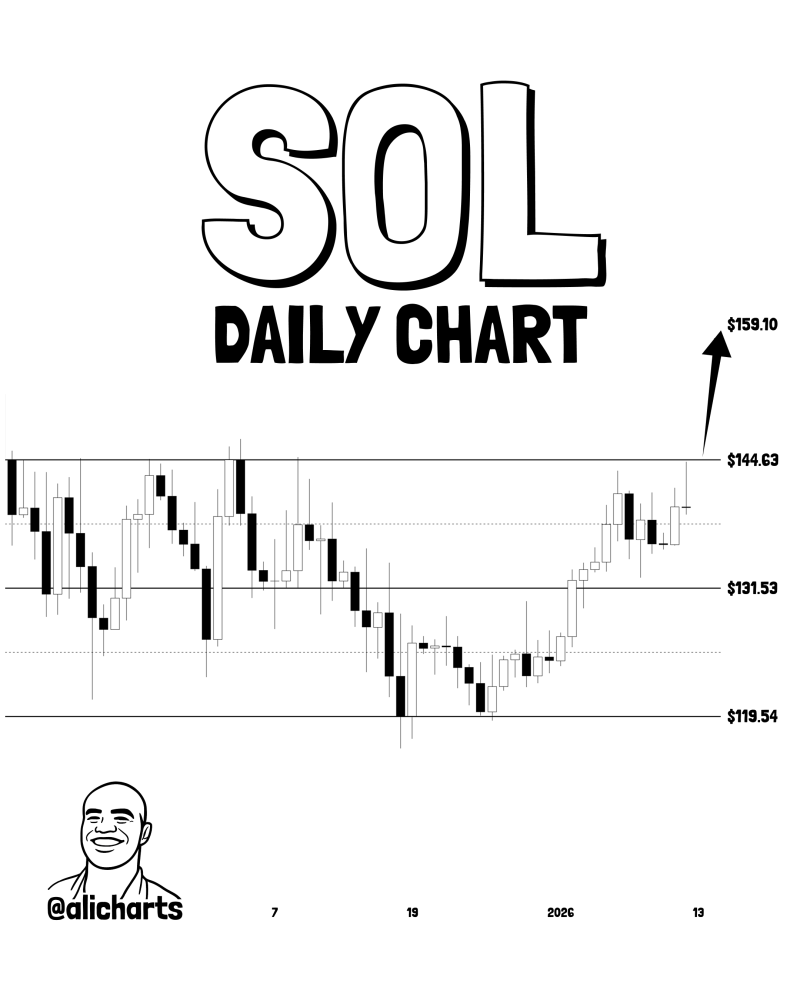
⬤ Before this breakout happened, Solana was basically going nowhere. It kept bouncing off $131.53 and occasionally dipping down to test the $119.54 zone. That kind of sideways grind usually means the market's trying to figure out its next move. The fact that buyers finally stepped in and pushed price above resistance suggests the selling pressure has dried up. Instead of lower highs, we're now seeing higher lows form on the chart.
⬤ With SOL now trading above $144.63, the next logical target sits at $159.10. That's where the next major resistance zone shows up on the daily timeframe. What makes this breakout interesting is that it's not some wild vertical pump – it's developing gradually, which tends to hold up better over time. The cleaner the breakout structure, the more likely it is to actually follow through.
⬤ This matters beyond just Solana itself. As one of the most liquid altcoins out there, SOL often gives clues about where the broader market might be heading. If it can hold above $144.63 and push toward $159.10, that could signal strength returning to the altcoin sector. Right now, all eyes are on whether this level holds or if it turns into another fakeout.
 Usman Salis


