 Usman Salis

⬤ Solana just pulled off a quick recovery after dipping below its trading range. SOL swept through the range lows near $120 and is now rotating back toward the upper end. The 4-hour chart shows a sharp drop followed by an equally fast bounce, suggesting the short-term positioning just got reset.
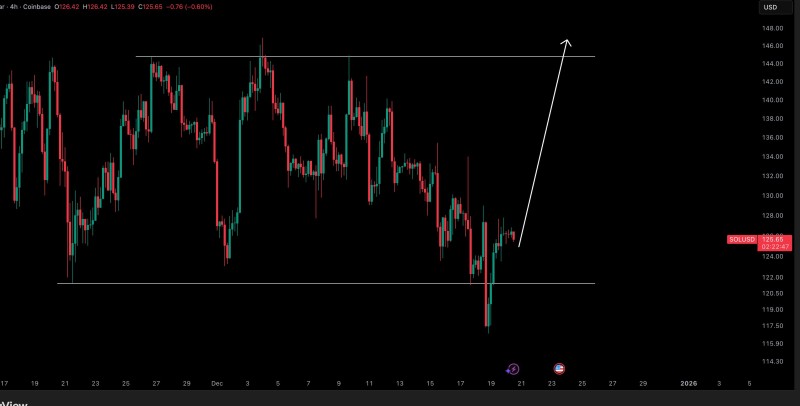
⬤ The chart shows a clear range that's been guiding SOL lately. Support sits around $120, while resistance caps out near the mid-$140s. Price briefly broke down into the high-$110s before aggressively reclaiming the range and settling back into the $125-$127 zone.
⬤ After reclaiming the range, Solana's price action has stabilized above former support levels. The chart projects a potential move toward the range high, making that upper boundary the next key level to watch. The failed breakdown suggests downside momentum has cooled off for now.
⬤ This matters because failed breakdowns often shift market sentiment and liquidity. When price retakes a range after sweeping lows, attention typically moves to the opposite side. How SOL reacts near upper resistance could shape short-term volatility heading into year-end.
 Usman Salis


