 Marina Lyubimova

⬤ SHIB is back on traders' radar after its 4-hour chart began forming what looks like a double-bottom pattern near a critical support zone. The meme token has repeatedly bounced from a narrow range between $0.00000524 and $0.00000530, suggesting buyers have been consistently stepping in at these levels.
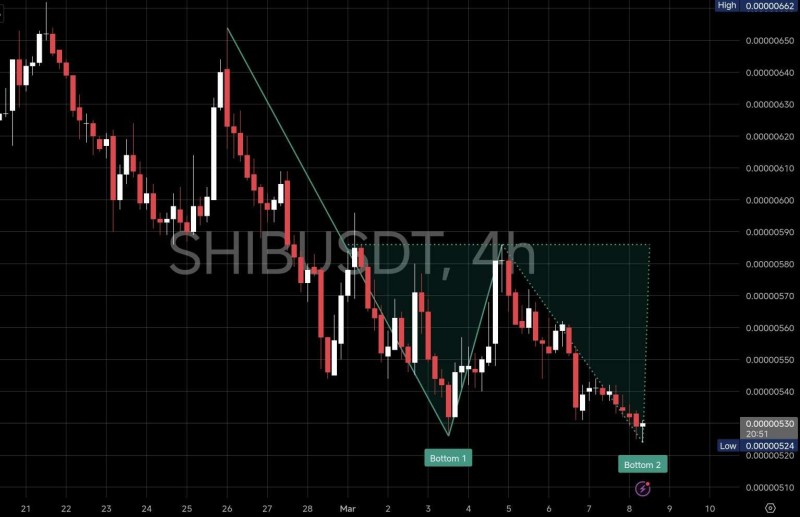
⬤ The first bottom took shape on March 2, when SHIB dipped to roughly $0.00000526 before staging a short-lived recovery. The token then resumed its descent within a broader declining trend. A second bottom followed on March 8, with SHIB briefly touching $0.00000523 before bouncing again, closing the session near $0.00000529 and reinforcing the strength of this support band. According to SHIB Price Prediction: Analyst Sees 2-3x Potential for Shiba Inu at $0.00000583, chart patterns and support zones frequently guide expectations for potential rebounds.
⬤ The broader chart still reflects a descending structure, but back-to-back reactions at the same price zone tend to attract attention from technical traders. If the double-bottom setup holds, SHIB could push toward the nearest resistance region between $0.00000555 and $0.00000565. Historical precedents for this kind of move are covered in Shiba Inu Bulls Defend Key Support Zone Before Next Breakout, where similar setups preceded notable price action.
⬤ The pattern's validity hinges entirely on whether current support holds. A decisive break below $0.00000520 would invalidate the setup and confirm that selling pressure remains in control. As explored in SHIB Price Analysis: Token Tests Support Zone After 1,237% Rally History, strong support zones have historically influenced SHIB's short-term direction, making the current level a key area to watch for any sign of trend stabilization.
 Marina Lyubimova


