 Eseandre Mordi

⬤ PEPE's weekly chart is showing a classic head and shoulders formation that's been building over the past few months. The pattern's measured target lands around 0.0000014 USD, matching up with extended Fibonacci projections. You can see the clear structure: left shoulder, sharp peak at the head, and a gradually formed right shoulder that led into the current decline.
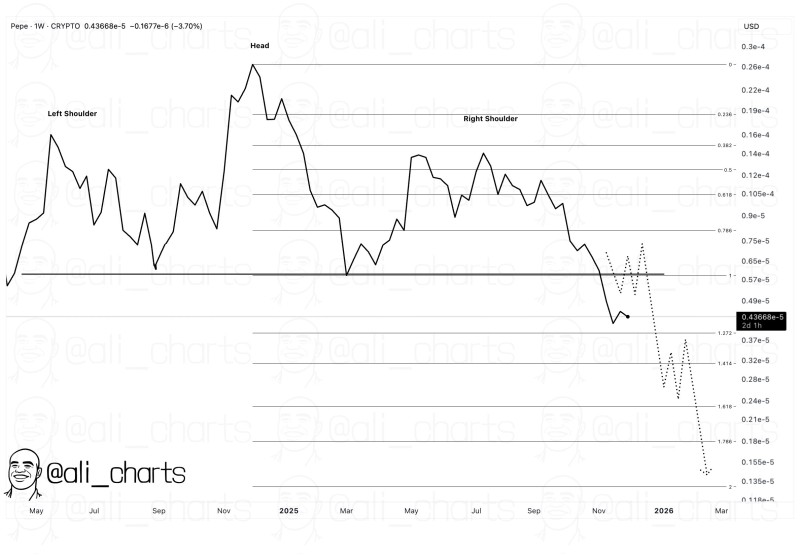
⬤ The token's trading near 0.00000436 USD after breaking below the neckline support zone between 0.0000065 and 0.0000057 USD. Chart projections suggest PEPE might attempt some choppy consolidation before continuing lower. Key Fibonacci levels include 1.272 at 0.0000037 USD and 1.414 around 0.0000032 USD—both acting as potential stopping points before the main 0.0000014 USD target. Momentum's looking weak across the meme coin sector right now.
⬤ The right shoulder formation shows declining highs, confirming the bearish bias. Recovery attempts at former support levels haven't gained much traction, and the technical setup suggests any bounce could face resistance. Lower liquidity in smaller-cap tokens plus broader crypto market choppiness adds extra uncertainty to PEPE's path forward.
⬤ Large-scale technical patterns on higher timeframes often signal extended price moves. If PEPE follows through toward 0.0000014 USD, it would reflect growing caution around speculative plays and potentially signal a broader shift in risk appetite across digital assets.
 Eseandre Mordi


