Saad Ullah

⬤LTC price action is drawing attention as Litecoin continues to trade near the $55 support level on the monthly chart. The coin is holding just above this key zone while remaining well below its 200-week moving average, a long-term indicator that reflects broader trend conditions. Litecoin recently recorded one of its lowest monthly RSI readings on record, suggesting bearish momentum may have reached an extreme before early signs of stabilization emerged.
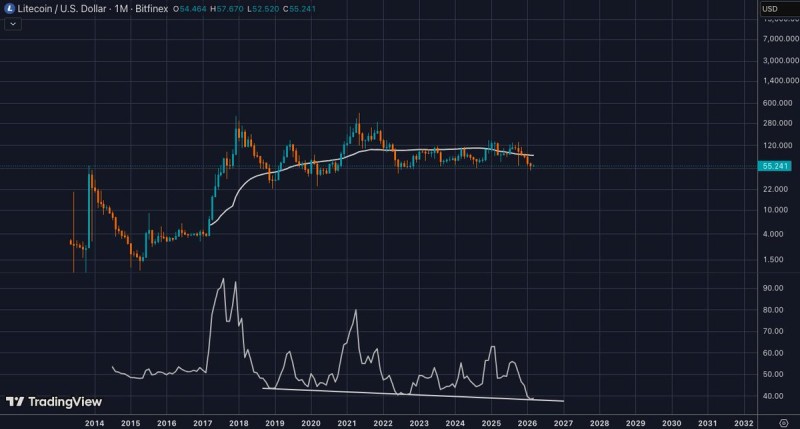
⬤The long-term structure of LTC highlights multiple market cycles over the past decade, each featuring sharp rallies followed by extended consolidation. Right now, Litecoin is positioned near $55, which has proven to be a major support area on higher timeframes. The 200-week moving average remains above the current price, confirming that LTC is still trading below its long-term trend benchmark. Litecoin Faces Liquidity Sweep Before Recovery Setup explores how volatility events like this can often precede stabilization phases in the LTC market.
⬤Momentum indicators add important context to recent price behavior. The RSI dropped to one of its lowest levels in recent history last month but now appears to be curling slightly upward, hinting at a shift in momentum. This subtle change may indicate that selling pressure is starting to ease as Litecoin stabilizes around the $55 region. Litecoin (LTC) Faces Resistance as Price Retreats to $97.8 Following Recent Rally discusses how key support zones like this typically determine the next directional move for the asset.
⬤The combination of long-term support and improving momentum puts LTC at a notable technical juncture. While Litecoin still trades below its 200-week moving average, holding the $55 level alongside an early RSI recovery suggests the market could be entering a period of stabilization. Historically, extended consolidation near major support zones has preceded larger directional moves in crypto market cycles, making the current setup worth watching closely.
 Saad Ullah