 Eseandre Mordi

⬤ Ethereum is losing steam near the $2,300-$2,350 range on the 2-hour chart. The price recently tested local highs before retreating, pointing to a possible slowdown in the current uptrend. As analyst Sky noted, ETH continues to print a bearish divergence, suggesting momentum may be fading even as price stays elevated.
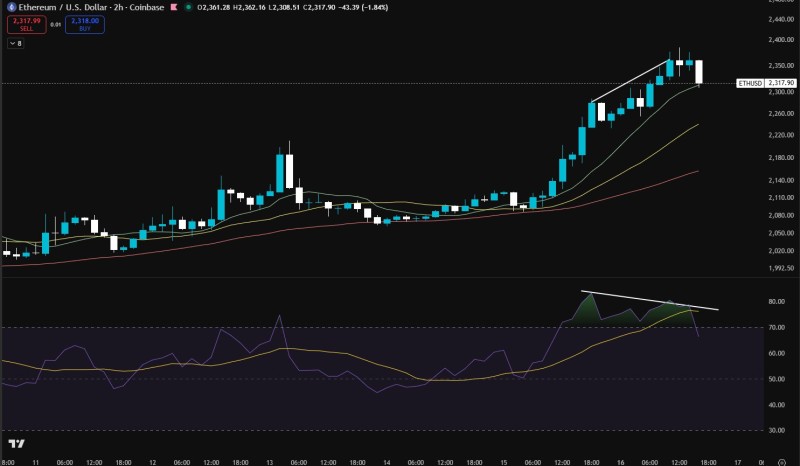
⬤ The setup shows a classic split between price and the RSI: ETH is posting higher highs while the RSI trends lower. This kind of bearish divergence is often an early warning for a short-term correction. Ethereum still holds above key moving averages, including the 100-period SMA, which acts as the most likely downside target if a pullback materializes.
⬤ Despite the warning sign, the broader trend structure stays intact - higher highs and higher lows are still in place. Similar setups in the past often led to brief consolidations rather than sharp reversals. Past analysis of comparable patterns, including XRP's bullish divergence setup, showed that divergences alone rarely determine the next big move.
⬤ Ethereum is at a technical crossroads between continuation and correction. Momentum signals call for caution, but price structure still looks constructive. As seen in prior tests of key levels, including when ETH tested the $1,990 support zone, the direction of the next move will ultimately depend on whether buyers step in before the 100 SMA is reached.
 Eseandre Mordi


