Usman Salis

⬤ Ethereum's monthly chart continues to display a solid bullish structure, with the long-term uptrend holding firm across several market cycles. Price action has consistently respected rising structural support zones, indicating that the broader positive trend remains intact on higher timeframes.
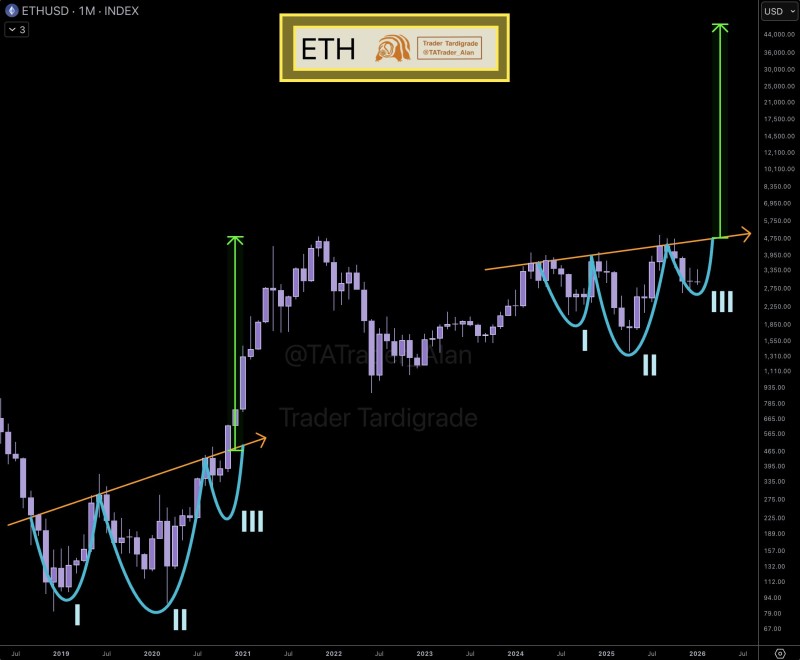
⬤ The monthly pattern reveals a repeating cycle where Ethereum goes through extended consolidation phases before launching into strong upward moves. Each pullback has formed above rising support levels, meaning corrections have been structural rather than trend-reversing—a behavior that previously led to major rallies in Ethereum's history.
⬤ Looking at the bigger picture, Ethereum's monthly structure shows a series of higher lows and sustained trend continuation. Past consolidations have historically transitioned into powerful upside movements once resistance was cleared. Right now, price remains within this established framework with no breakdown of the long-term bullish structure visible on the monthly timeframe.
⬤ This matters for the broader crypto market because Ethereum acts as a major benchmark for overall market direction. A stable bullish structure on the monthly chart typically supports market confidence and trend stability. As long as Ethereum holds this macro formation, it serves as a critical reference point for gauging long-term momentum across digital assets.
 Usman Salis