 Peter Smith

⬤ Ethereum's price is currently bouncing off support levels that were identified earlier, following some sharp price swings. The latest chart update simply shows where ETH is trading right now and how it's reacting to those previously mapped support and resistance zones. This isn't about predicting direction—it's about watching price behavior at key technical levels.
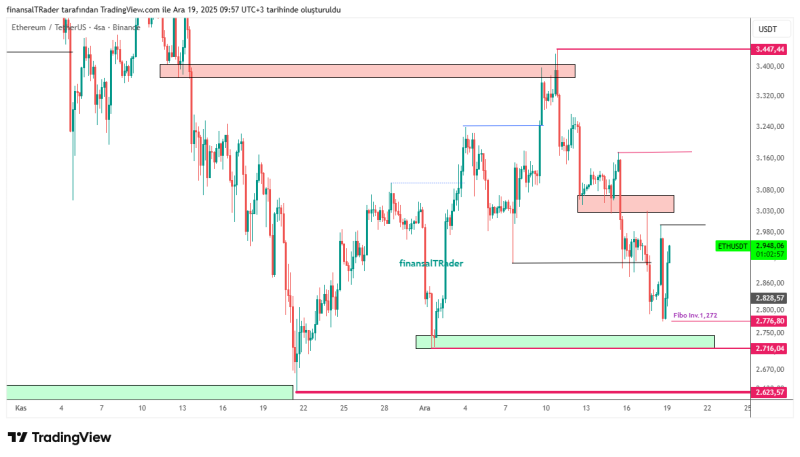
⬤ The chart shows Ethereum dropped hard from the upper resistance area between $3,300 and $3,400, where sellers stepped in before. After getting rejected there, ETH fell toward a demand zone sitting around $2,700 to $2,780. That lower area lines up with a Fibonacci level near $2,776, and price clearly reacted when it hit that spot.
⬤ Following that bounce from support, Ethereum climbed back toward the $2,900 to $3,000 range, where it's currently moving sideways. There's more resistance waiting above at $3,100 and $3,200—levels that caused reactions before. The chart doesn't show a clean breakout or breakdown yet, just ETH trading within the boundaries of these technical zones.
⬤ What this tells us is that Ethereum keeps respecting these well-defined support and resistance areas, even when the market feels uncertain. Instead of breaking through impulsively, price is reacting at these levels, which shows the market is still following technical structure. When you're watching ETH through consolidation phases after big moves, these mapped levels become really important for understanding what might happen next.
 Peter Smith


