 Usman Salis

Ethereum's recent price action has cleared crucial downside liquidity zones, setting the stage for a potential move toward the $2,100 level. After dipping below $2,000, ETH has stabilized in a narrow range while heatmap data reveals a significant overhead cluster that could influence the next directional move. Market participants are now watching whether this liquidity concentration will act as a magnet for price discovery.
Downside Liquidity Cleared - ETH Stabilizes Above Mid-$1,900s
Ethereum's short-term downside liquidity has been taken out, leaving price to stabilize in a narrow range after a sell-off below $2,000. This liquidity sweep clears weaker stops and has created a visible concentration of leverage and liquidation zones overhead. The ETH heatmap chart shows the largest cluster of interest forming near the $2,100 level, suggesting this could be the next technical focal point if price begins to retrace.
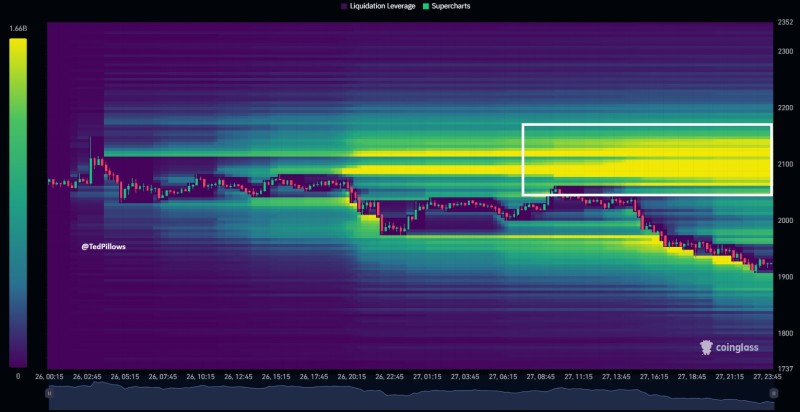
The provided heatmap highlights intensity bands between roughly $2,080 and $2,150, marked by yellow and green layers that represent large pockets of resting positions that have not yet been captured by price action. Ethereum currently trades near the mid-$1,900s, and with downside liquidity visibly depleted below current levels, the focus is turning to where this new overhead cluster could influence movement.
"This liquidity sweep clears weaker stops and has created a visible concentration of leverage overhead," noted market analyst Ted.
Historical Patterns Point to $2,100 as Next Major Target
A cluster of this magnitude often represents an area where market makers and algorithmic flows may gravitate, as tapping such levels can trigger cascades of forced liquidations and stop orders that fuel momentum toward the target zone. Historically, similar setups have appeared when downside liquidity is exhausted and price begins to interact with the next major concentration of liquidation interest.
Ethereum has previously cleared downside liquidity before moving toward prominent clusters, such as the one between $3,800 and $4,000 observed in late 2025. That scenario saw the market seek out heavy liquidity overhead after stops below were taken, which aligns with the current heatmap setup where $2,100 now looms as a key area of interest.
The presence of an overhead liquidity cluster near $2,100 is significant because it highlights where positioning remains thick and potential price reactions could occur. If Ethereum engages this zone, it may either act as resistance that limits upside in the near term or, if absorbed, pave the way for broader market flows to recalibrate above current ranges.
Market observers who followed previous Ethereum price predictions targeting the $4,500 level will recognize similar patterns emerging. Tracking how price interacts with this layer may help clarify whether recently cleared downside liquidity shifts momentum back toward buyers or consolidates within the existing range, particularly as traders question will $4,600 resistance finally break in future rallies.
 Usman Salis


