Saad Ullah

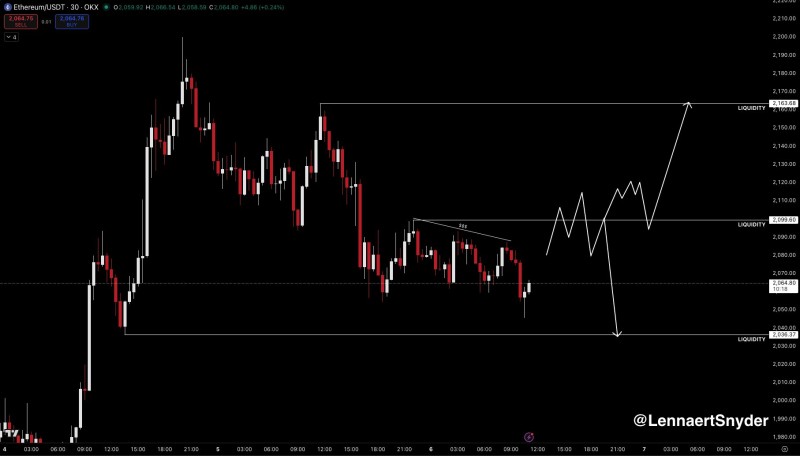
Ethereum is currently trading in a tight range around the $2,060 area, maintaining its position above a critical support level near $2,036. The digital asset has been consolidating below a descending intraday trendline on the 30-minute chart, creating a setup that could deliver significant trading opportunities as the week closes.
Recent price movement shows Ethereum swept through sell-side liquidity around the $2,036 level before stabilizing above that zone. This development has created a potential Smart Money Technique (SMT) divergence with Bitcoin, which could support a short-term upward push. If support continues holding firm, the next target becomes the buy-side liquidity area clustered near $2,099. Similar resistance dynamics were explored in Ethereum Faces $2,080 Resistance as Downside Liquidity Lures Action, where ETH traded below a resistance cluster in the $2,080-$2,100 zone while liquidity accumulated around key technical levels.
Two Scenarios: Rejection at $2,099 or Breakout Higher
The current chart setup presents two distinct paths for Ethereum's immediate future. In the first scenario, if ETH sweeps liquidity above $2,099 but fails to hold that level, analysts suggest this could trigger a bearish market structure break and create opportunities for short positions. However, if price manages to reclaim and sustain levels above $2,099, the bearish thesis would likely be invalidated, opening the path toward the next liquidity cluster near $2,163.
This type of consolidation pattern below resistance has appeared in previous Ethereum setups. In Ethereum Faces Wedge Resistance at $1,985 While Testing 20-Day Average, analysts observed ETH compressing within a tightening range before eventually breaking out. The current structure shows similar characteristics, with price coiling between well-defined support and resistance zones while liquidity builds on both sides.
Nonfarm Payrolls Data Could Amplify Volatility
Beyond technical factors, macroeconomic catalysts may play a decisive role in how this setup resolves. The U.S. Nonfarm Payrolls report is scheduled for release, and this monthly employment data often introduces significant volatility across financial markets, including cryptocurrencies. With Ethereum positioned between major liquidity zones at $2,036 and $2,099, the market's reaction to economic data combined with these technical levels could determine whether ETH extends its consolidation phase or breaks toward higher targets.
Similar uncertainty around key resistance zones was documented in ETH Rejected Near $2,000: Key Support at $1,850-$1,900 Now in Focus, which examined how repeated failures near resistance can shape the next market direction. In that instance, ETH faced multiple rejections before eventually resolving with a clear directional move. The current setup shares comparable characteristics, with liquidity zones acting as magnets for price action and potential turning points for trend development.
 Saad Ullah