 Saad Ullah

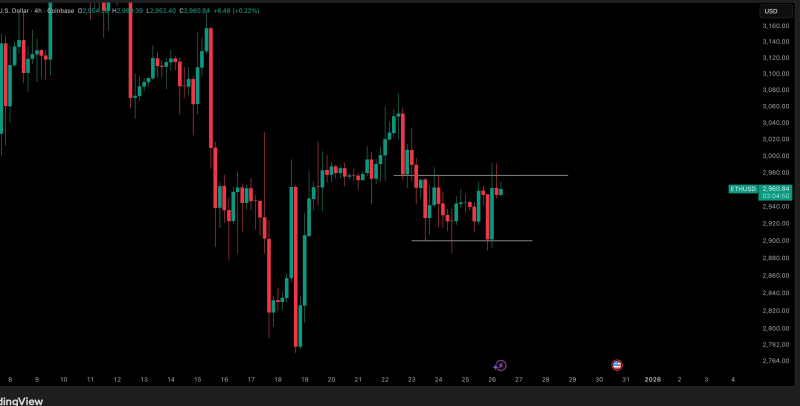
⬤ Ethereum continues trading in a narrow range just below the critical $2,980 resistance level. The chart shows ETH/USD near $2,960 on Coinbase, caught between well-defined boundaries with resistance around $2,980 and support near recent lows. A confirmed break above that ceiling could signal a shift in momentum.
⬤ ETH has failed multiple times to hold above $2,980, which has become a short-term cap on price action. A sustained move above this level with solid acceptance would mark a constructive development. But if Ethereum shows weakness from here instead of breaking through, the outlook turns bearish with a likely drop back toward the previous low zone.
A confirmed reclaim of that price level is being viewed as a potential trigger for long positioning, analysts noted.
⬤ The 4-hour chart reveals price compression between resistance just under $3,000 and the local support floor, with multiple sessions respecting these boundaries. This reinforces how crucial the $2,980 reaction point is for determining whether momentum builds or fades.
⬤ This setup matters because clearly defined resistance zones like $2,980 often catalyze shifts in sentiment and positioning across the crypto market. A clean breakout would signal improving confidence, while rejection could trigger fresh selling pressure. With Ethereum serving as a key benchmark in digital assets, traders are laser-focused on how price behaves at this technical level.
 Saad Ullah


