 Saad Ullah

⬤ Ethereum dominance is holding strong on the weekly chart after bouncing back from earlier corrections this year. Right now, ETH.D sits around 12.2% following a consolidation phase. The weekly supertrend indicator is still flashing bullish signals after support held firm during the latest retest.
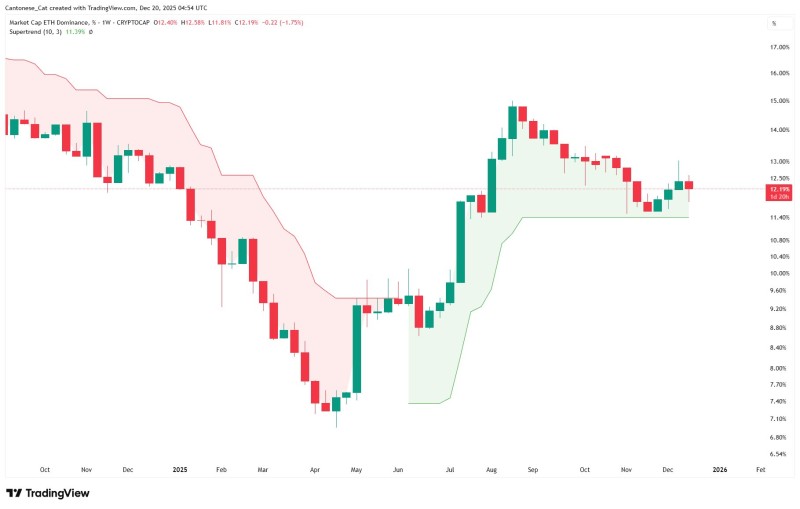
⬤ The chart tells an interesting story. Ethereum dominance dropped from around 16% in late 2024 all the way down to a cycle low near 7% in early 2025. From there, it reversed course and climbed back toward 15% by mid-2025—a major shift in market structure. Things cooled off in the second half of the year, but the overall recovery remains impressive.
⬤ The recent pullback tested the supertrend support zone between 11% and 11.5%. That level held, and weekly candles have stabilized instead of breaking down. Price action shows consolidation above trend support with volatility tightening compared to the wild swings we saw earlier in the year. This looks more like a healthy pause than a trend reversal.
⬤ Why does this matter? Ethereum dominance works as a key indicator for how capital moves between ETH and the broader altcoin market. Support holding above current weekly trend levels suggests Ethereum is keeping its relative strength. Any major shift around this zone could influence sentiment across the market and reshape capital flows in the coming weeks.
 Saad Ullah


