 Saad Ullah

⬤ Ethereum (ETH) is once again caught in a prolonged downtrend that looks pretty familiar if you've been watching the charts over the past two years. ETH's historical corrections tend to drag on way longer than most traders expect before finally breaking out. The three-day ETHUSDT chart shows this pattern clearly—extended downward channels instead of quick, sharp drops.
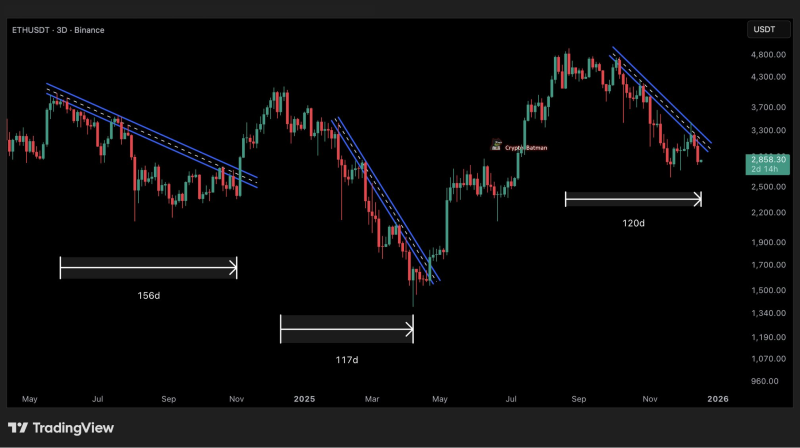
⬤ Looking at the data, Ethereum has gone through several distinct downtrend phases, each stretching across multiple months. One decline lasted around 156 days, while two other corrective phases ran for roughly 117 days and 120 days each. Every time, the price moved steadily lower within descending trendlines before stabilizing and eventually recovering. Right now, ETH is still trading inside a similar downward channel without any confirmed reversal signal.
Ethereum's corrections tend to be time-consuming rather than abrupt—patience has historically played a key role during these downturns.
⬤ These patterns tell us that Ethereum's corrections aren't about sudden crashes and quick bounces. Instead, ETH typically consolidates for months as selling pressure slowly fades away. The chart shows breakouts only happened after extended periods of price compression, which means waiting it out has been crucial during past Ethereum downturns. The fact that similar timeframes keep repeating across multiple cycles suggests there's a consistent rhythm to how ETH behaves during corrections.
⬤ This matters for the broader crypto market because Ethereum sits at the heart of DeFi, layer-two networks, and smart contract ecosystems. When Ethereum goes through prolonged corrections, it tends to weigh on overall market sentiment and risk appetite. Understanding that extended downtrends have come before recoveries in the past gives helpful context for what we're seeing now—time-based consolidation is just part of Ethereum's market behavior, not something unusual.
 Saad Ullah


