 Usman Salis

⬤ Ethereum hit a wall at $3,000 and couldn't push through. The attempt to reclaim this psychological level was brief, and ETH quickly slipped back down. On Binance's daily chart, Ethereum is hovering just below the $3,000 mark, with clear resistance zones stacked above and solid support levels waiting below. Without a daily close above $3,000, Ethereum remains stuck in its recent trading range.
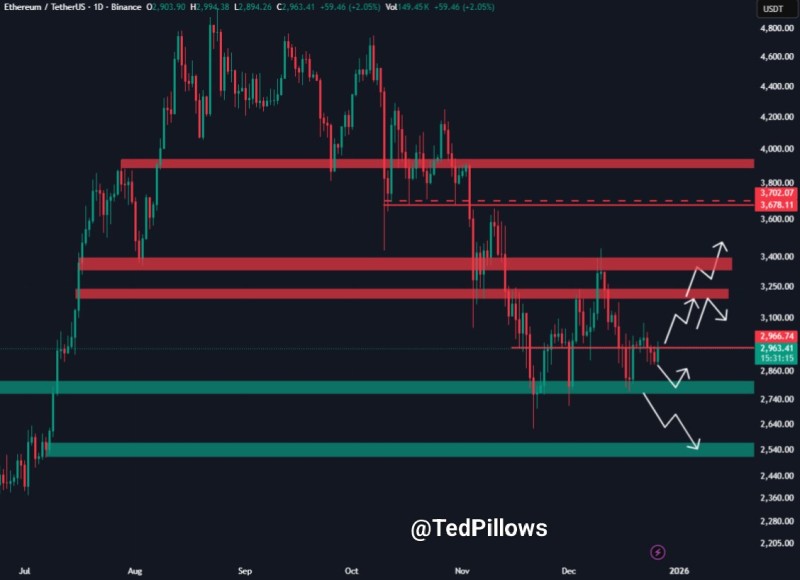
⬤ The $3,000 to $3,100 zone has become a supply wall lately, with sellers consistently showing up whenever Ethereum gets close. Looking down, the next important level sits around $2,800, where ETH found its footing several times throughout December. If Ethereum can't break through and actually hold above $3,000, there's a good chance we'll see another test of that $2,800 support before any clear direction emerges.
⬤ The chart shows multiple possible scenarios for where price could head next. If Ethereum manages to firmly break above $3,000 and hold it, we could see a gradual recovery. But there are also paths where the price softens and heads back down to test support levels. Deeper support zones are marked further below, showing traders are keeping a close eye on these technical areas while ETH trades in a relatively tight range compared to its earlier volatile swings.
⬤ Ethereum continues to be one of the most watched cryptocurrencies out there. How price behaves around the $3,000 resistance and $2,800 support could shape broader crypto market sentiment. Whether ETH can flip resistance into support or instead drops to lower liquidity zones will likely set the tone for near-term momentum as traders watch for the next big move.
 Usman Salis


