 Marina Lyubimova

⬤ Ethereum is showing a clear inverse head and shoulders structure on the weekly chart, pointing to a possible shift in market sentiment. ETH has finished forming the lowest part of the right shoulder and is now moving toward the neckline. The chart shows a steady recovery after the previous drop, bringing Ethereum close to an important resistance area.
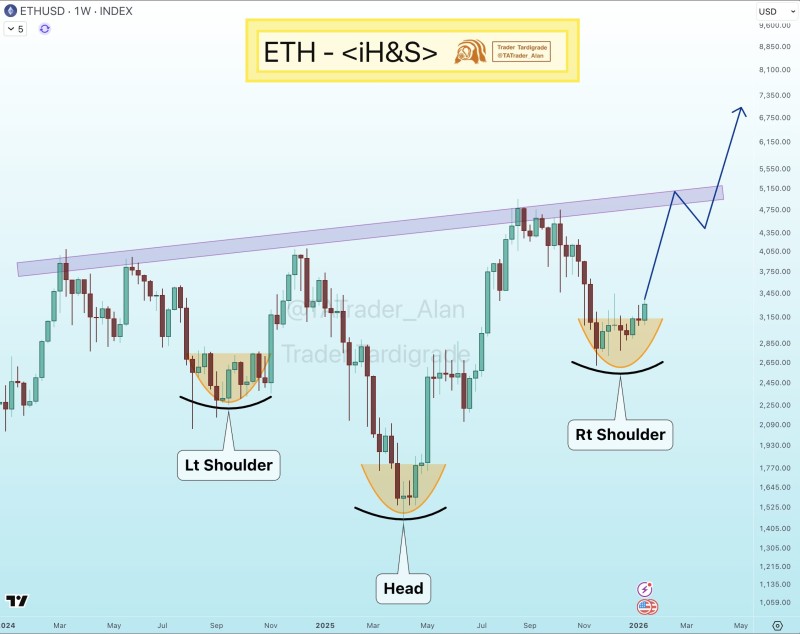
⬤ The pattern includes a left shoulder formed earlier, a deeper middle low that marks the head, and a higher low defining the right shoulder. This setup typically signals a change from bearish pressure to stabilization. Ethereum is trading within a rising channel, which suggests the overall price structure is supporting this move toward the neckline rather than pushing for an immediate rejection.
⬤ Recent weekly candles demonstrate better price stability compared to when the head was forming. While a breakout hasn't happened yet, ETH is holding above the right shoulder low, showing consistent buying interest at higher price levels. The neckline, drawn across past highs, remains the key level that will determine if the pattern continues developing. Until that level gets tested, Ethereum stays in a buildup phase.
⬤ This technical formation matters for the wider crypto market since Ethereum often drives sentiment across major altcoins. The move toward the neckline could influence short-term expectations around volatility and trend direction. However, confirmation at this level is needed before drawing bigger conclusions, making it essential to watch how price behaves as ETH approaches this resistance zone.
 Marina Lyubimova


