 Usman Salis

Ethereum is entering a fragile technical phase, hovering near $2,046 while struggling to regain momentum. As CyrilXBT noted in his latest chart breakdown, the structure reflects persistent weakness, with ETH barely holding above $2,000 and key resistance levels still out of reach.
The ETH Breakdown That Shifted Momentum
The chart tells a clear story. Ethereum broke down sharply from higher levels and lost the $2,400–$2,500 region, which has since flipped into a firm resistance zone. Recent recovery attempts have failed to reclaim it, leaving price trapped below a major supply area.
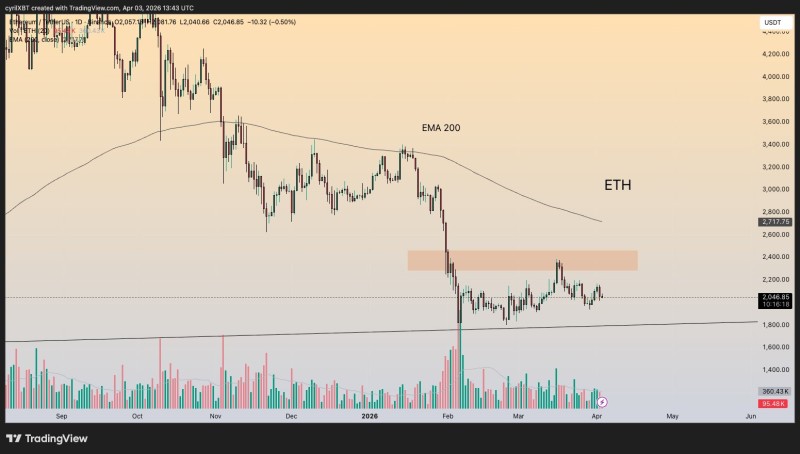
Since the drop, ETH has been printing a sequence of lower highs - a classic sign that sellers remain in control despite short-term consolidation. Former support zones flipping into resistance after a breakdown is a well-documented technical pattern, and it's playing out precisely here.
Why the $2,717 Gap to the 200 EMA Matters for Ethereum
One of the most telling features on the chart is the 200 EMA sitting around $2,717. Current price is trading significantly below that level, which underscores just how extended the downtrend has become.
Price remains significantly below the 200 EMA near $2,717, emphasizing the strength of the prevailing downtrend.
In healthier market conditions, price tends to interact with major moving averages more closely. The wide gap here tells a different story - bullish momentum is thin, and any meaningful recovery would need to close that distance before sentiment can realistically shift.
A Fragile Floor With Little Room Below $2,000
Ethereum is now consolidating just above the $2,000 mark, which is serving as immediate support. The chart makes the risk picture fairly straightforward - if $2,000 gives way, the next meaningful floor sits near $1,800.
That creates a tight structure with clearly defined levels:
- $2,200 - the level ETH needs to reclaim to shift sentiment
- $2,000 - current support holding price in place
- $1,800 - the last major support before further downside opens up
Repeated tests of support increase the risk of a breakdown, especially in a structure defined by lower highs.
The $2,000 zone carries significance beyond this chart. As seen in previous ETH cycle analysis, this level has repeatedly acted as a structural pivot across multiple market phases.
The Signal ETH Traders Are Watching Now
The current setup leaves Ethereum compressed between resistance overhead and support below, with no confirmed reversal on the table yet. Structure is dominating over momentum, and that's rarely a bullish condition.
Until ETH reclaims $2,200, the chart stays technically weak. Repeated tests of the $2,000 floor only increase the probability of an eventual breakdown - particularly in a trend already defined by lower highs.
For now, Ethereum is holding - but only just. The next decisive move out of this range will likely set the tone for the broader trend ahead.
 Usman Salis


