 Victoria Bazir

Ethereum is consolidating tightly around the $2,000 level, with price action showing no clear directional bias yet. As noted by Ted, ETH remains in a sideways range, but the structure suggests that a decisive move is approaching, with clear levels defining both upside and downside scenarios.
Ethereum Sideways Range Forming After Sharp Decline
The chart shows Ethereum stabilizing after a steep drop from higher levels, transitioning into a horizontal range rather than immediate continuation. Price is moving between defined zones, with no sustained trend in the short term.
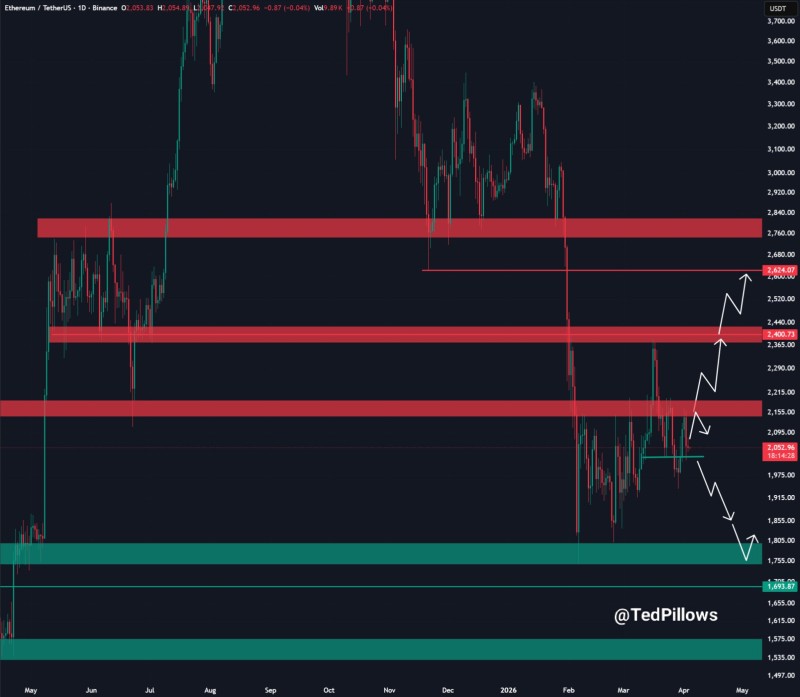
This type of structure reflects indecision, but it is forming after a strong bearish move, meaning the broader context still leans fragile.
The structure suggests that a decisive move is approaching, with clear levels defining both upside and downside scenarios.
The candles are compressed, with repeated attempts to push higher and lower failing to establish control.
Why the $2,100-$2,150 Ethereum Resistance Zone Is Critical
The upper boundary of the current range sits around $2,100-$2,150, which is clearly marked on the chart as a resistance band. Price has approached this zone but failed to break through, confirming it as a barrier for any bullish continuation.
A breakout above $2,100-$2,150 would represent a real shift in short-term structure.
A breakout above this area would represent a shift in short-term structure and open the door for further upside movement. ETH Price Analysis: Ethereum Tests $3000 as Market Eyes $3800 Recovery shows just how fast sentiment can shift when key levels break. Until that happens, the range remains intact and capped from above.
The Risk Building Below $2,000
On the downside, the $2,000 level stands out as the key support referenced in the setup. Price is hovering just above it, with multiple tests indicating growing pressure.
According to the scenario outlined:
- A move above $2,100-$2,150 signals potential upside continuation
- Continued sideways movement keeps ETH locked in consolidation
- A break below $2,000 could trigger a sharp liquidation-driven drop
The chart also visually maps a potential downside path toward lower support zones, suggesting that if $2,000 fails, the move could accelerate quickly.
Ethereum Market Waiting for Resolution
Ethereum is effectively trapped between resistance and support, with both breakout and breakdown scenarios clearly defined. The longer price remains compressed within this range, the more significant the eventual move is likely to be.
The longer price stays compressed in this range, the more significant the eventual move is likely to be.
Similar technical setups in the crypto market have often led to sharp directional moves once key levels give way, especially when price repeatedly tests both boundaries. XRP Eyes Breakout as BTC Dominance Nears Peak is one recent example of how quickly things can shift when consolidation breaks.
For now, ETH remains in balance, but not for long.
 Victoria Bazir


