Alex Dudov

Ethereum is entering a critical phase as price compresses around a key technical level. According to CyrilXBT, ETH spiked to around $2,400 in mid-March and has been declining ever since, now stabilizing near the 200 EMA at approximately $2,104. Rather than collapsing outright, price is grinding sideways - a pattern that often precedes the next decisive leg.
Where ETH momentum faded after the $2,400 spike
The chart shows Ethereum pushing into the $2,400 region before losing steam. Following that move, price has been trending lower in what can best be described as a slow bleed, drifting back toward key moving averages without any strong reversal attempt from buyers.
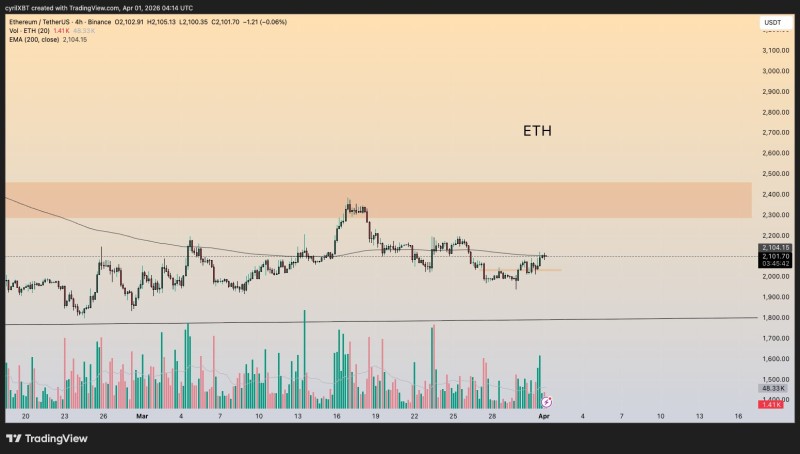
ETH has been bleeding since the spike and is now compressing around the 200 EMA - a behavior that points to stabilization rather than a clean breakdown.
This behavior reflects a failed continuation after the rally. Buyers were unable to hold higher levels and are now watching price drift back into a decision zone where the next move will likely be determined.
Compression around the 200 EMA near $2,104
Currently, ETH is holding around the 200 EMA near $2,104. Instead of breaking down sharply, price is coiling around this level - a setup that often signals accumulation rather than distribution. ETH price analysis: Ethereum hits $2,380, eyes $2,500 breakout covered a similar compression phase in recent weeks, where the asset consolidated above major psychological zones before resolving direction.
When ETH compresses around a major moving average instead of breaking away from it, the market is still undecided - and that indecision itself becomes the setup to watch.
This type of price action suggests stabilization rather than breakdown. Similar setups have historically seen Ethereum consolidate above key levels before launching the next directional move, particularly when holding above major psychological zones like $2,000.
ETH key levels: $1,800 support vs. $2,300-$2,500 resistance
The current structure is clearly defined by three major levels:
- $1,800 - key downside support that has not yet been tested in this cycle
- $2,000 - near-term floor acting as the next test if buyers lose control
- $2,300-$2,500 - strong resistance zone and the primary barrier to renewed upside
Market structure across multiple recent analyses highlights this band as the critical decision area, where Ethereum tends to oscillate between $2,000 and $2,400 before resolving direction. A sustained hold above $2,000 keeps the bullish case alive; a break below shifts attention toward the $1,800 zone.
The $2,200 daily close that could shift ETH momentum
The key short-term trigger is $2,200. A clean daily close above this level would be the first meaningful signal toward a bullish shift in bias. Until that happens, the outlook remains neutral at best. Ethereum price prediction: ETH eyes $5,000 after healthy correction outlines the longer-term upside scenario that becomes relevant only after reclaiming these near-term resistance levels.
A clean daily close above $2,200 is the trigger - without that confirmation, the bias stays neutral and buyers remain on the back foot.
For now, ETH continues to compress around the 200 EMA, caught between the $2,000 floor below and a dense resistance cluster above. The next move depends entirely on whether buyers can reclaim $2,200 on a closing basis - or whether price slips toward the untested $1,800 support that has been waiting in the wings.
 Alex Dudov