 Saad Ullah

⬤ Ethereum has slipped below the $2,800 support zone after weeks of downside pressure. The daily chart shows ETH breaking through what had been a solid floor for recent price action. This breakdown puts Ethereum closer to lower support levels that could determine the next move.
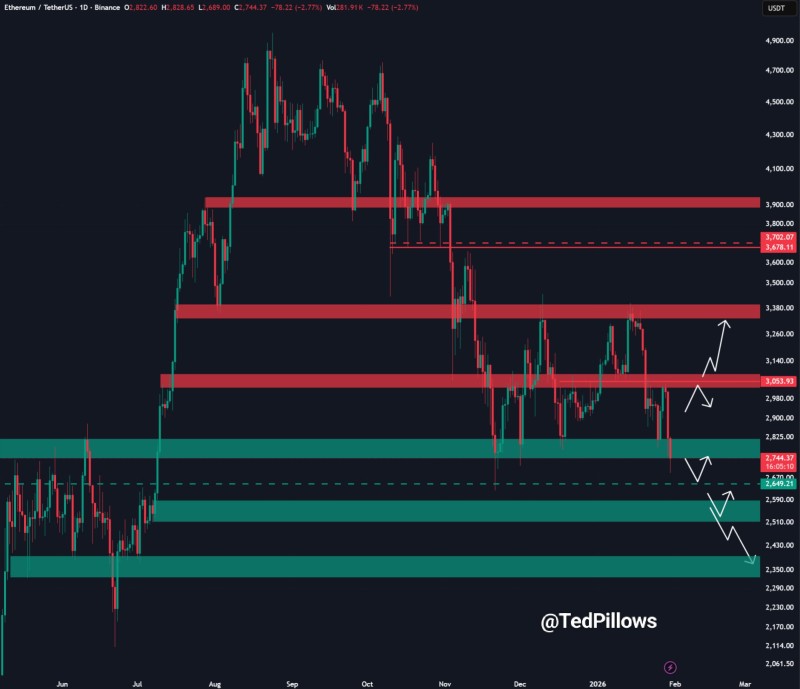
⬤ Before the drop, ETH struggled to break through resistance near $3,900 and $3,300. After getting rejected at both levels, the selling continued until $2,800 finally gave way. Once that support broke, Ethereum quickly moved down to the $2,700 area, signaling a clear shift from sideways trading to continued downtrend.
⬤ All eyes are now on the $2,500 to $2,600 range, which stands out as the next major demand zone. This area has attracted buying from ETFs and institutional traders, which could make it a potential support level for a short-term bounce. How Ethereum reacts here will likely shape near-term price action.
⬤ Ethereum's price movement matters beyond just ETH itself. As one of the largest cryptocurrencies, how it performs at this $2,500 to $2,600 support could influence sentiment across the broader crypto market. A successful hold might stabilize things, while a breakdown would likely trigger more selling pressure and strengthen the bearish trend.
 Saad Ullah


