 Marina Lyubimova

⬤ Ethereum's been grinding sideways after dropping from late 2025 highs, settling into a tight range around the $3,000 mark. The daily chart shows ETH defending a well-defined demand zone, though the price action looks messy. As one trader put it: "ETH may look weak on the surface, but it continues to hold demand." It's the kind of frustrating consolidation that keeps everyone guessing—not strong enough to rally, but not weak enough to collapse either.
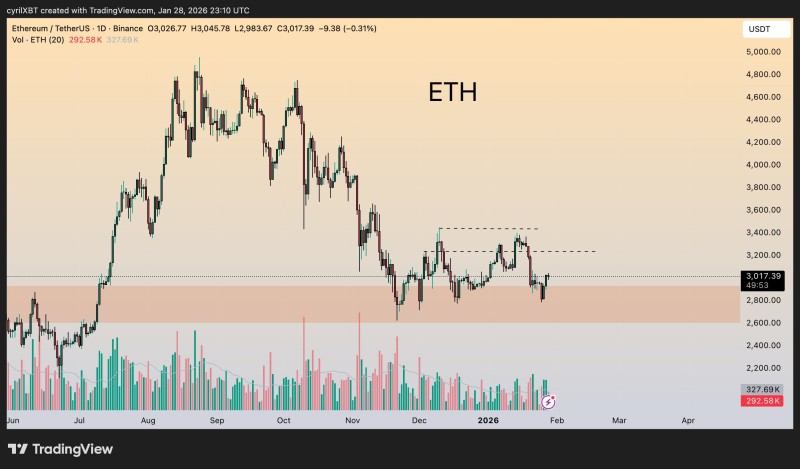
⬤ The bigger picture shows a clear downtrend that picked up speed before finding support somewhere between $2,700 and $2,900. Since hitting that low, ETH's been printing overlapping candles without much conviction in either direction. Every bounce attempt gets stuffed around $3,300 to $3,400, which lines up with resistance zones marked on the chart.
⬤ Volume's dropped off since the initial selloff, showing neither buyers nor sellers are willing to make aggressive moves. ETH hasn't broken back above key resistance, but it also hasn't cracked below demand. This kind of balance usually means the market's absorbing selling pressure, though we haven't seen confirmation of a reversal yet.
⬤ The consolidation matters beyond just ETH—Ethereum's price action tends to set the tone for the broader crypto market. As long as it holds this demand zone, the market stays in wait-and-see mode. A break below would likely trigger a hunt for lower support levels. For now, ETH's stuck in no man's land, with traders watching for the next real move.
 Marina Lyubimova


