 Alex Dudov

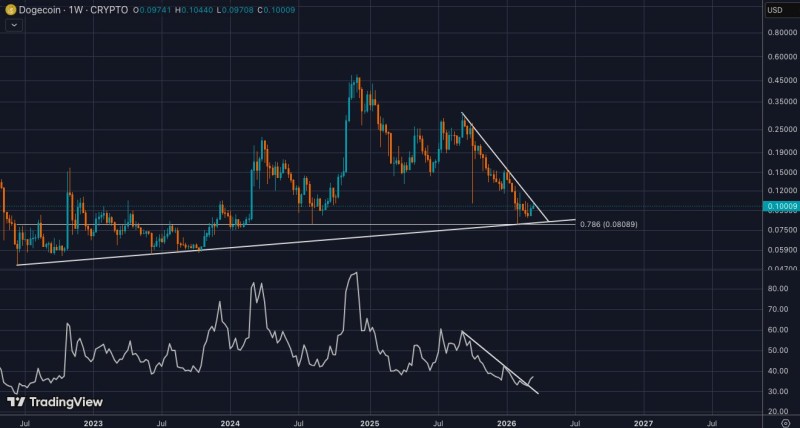
Dogecoin is at a pivotal moment. After sliding to multi-month lows, DOGE found solid footing near $0.08 and has since clawed back toward the $0.10 zone, where a descending trendline now stands in the way of further recovery. The weekly chart tells a straightforward story: support held, momentum is improving, but the breakout confirmation is still missing.
0.786 Fibonacci Level at $0.08 Holds as Key DOGE Support
The bounce originated from the $0.080-$0.081 range, a zone where the 0.786 Fibonacci retracement level converges with a long-term uptrend line. That kind of confluence rarely gets ignored by the market, and this time was no different. DOGE reversed right at that level and has been grinding higher since. Similar setups have been covered in depth in Dogecoin Eyes Breakout: Double Bottom Forms at $0.08 Support Zone, where the same area sparked a meaningful recovery.
RSI Breakout Signals Momentum Shift Before Price Confirms
Momentum is quietly shifting. The RSI downtrend line has already broken, which historically precedes price confirmation by a few sessions. That said, DOGE still has not closed above the descending resistance line that has been capping rallies since the recent peak. Until price breaks and holds above that level, the setup remains a waiting game. Analysts have pointed to similar pre-breakout conditions in DOGE Coin Price Eyes $0.27 Target as Meme Coin Breaks Key Resistance, where reclaiming resistance opened the door to a strong directional move.
The structure right now is clean: support at $0.08 is intact, momentum is recovering, and price is pressing against the one level that matters most. A weekly close above the descending trendline would shift the bias meaningfully. For a longer-term view of where DOGE could head next, the Dogecoin Price Forecast: $DOGE Targets $0.45 and Beyond outlines what a full recovery scenario could look like. Until then, the $0.10 reaction zone will define whether this bounce develops into something more.
 Alex Dudov


