 Alex Dudov

⬤ NASDAQ is trading in a narrow consolidation band between 24,520 and 24,650 on the hourly chart, following a reaction rally from recent lows. As Forex Sinyal Merkezi noted, the overall structure remains sideways within a broader downtrend, with limited recovery strength visible in recent sessions.
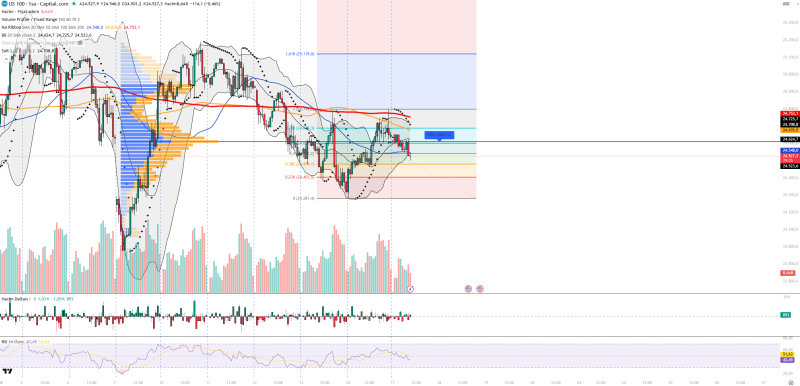
⬤ Overhead pressure from moving averages and a descending trendline continues to cap upside attempts. Immediate resistance sits at 24,650, with higher levels at 24,708 and 24,753. Support zones are located at 24,523, 24,402, and 24,281. The Volume Profile confirms a key liquidity zone near 24,611, where price keeps rotating. Similar resistance-driven behavior was documented in NASDAQ Drops From 25.15 as Index Slides Toward Key Support Levels, where repeated failures at resistance kept the index under pressure.
⬤ Indicator signals remain neutral with no confirmed directional breakout. RSI hovers near mid-levels, reflecting balanced momentum, while low trading volume signals limited participation. Volume Delta is equally split, pointing to indecision in order flow. Bollinger Bands place price near the middle band, reinforcing consolidation, while Parabolic SAR maintains a weak downtrend bias. A comparable setup was covered in Nasdaq Stalls at 25,100 as Range Tightens Between 24,650 and 25,100.
⬤ NASDAQ stands at a critical inflection point where consolidation meets persistent downside pressure. The inability to reclaim higher resistance, combined with macro headwinds including elevated interest rates and a strong US dollar, continues to weigh on price. As analyzed in NASDAQ (US100) Drops to 24.6K Support as Bears Hold Control, weak rebounds have so far failed to shift the broader bearish structure. The next move depends on whether the index can break above resistance or drift lower within the current range.
 Alex Dudov


