 Peter Smith
Cardano has been the altcoin everyone's watching this cycle, and the charts are telling a story that could make doubters eat their words. The long-term structure looks eerily similar to Cardano's previous rally setups, hinting that we might be about to see history repeat itself.
What the Charts Are Saying
Maelius recently pointed out that ADA is sticking above crucial support levels, and the technical picture screams bullish momentum ahead.
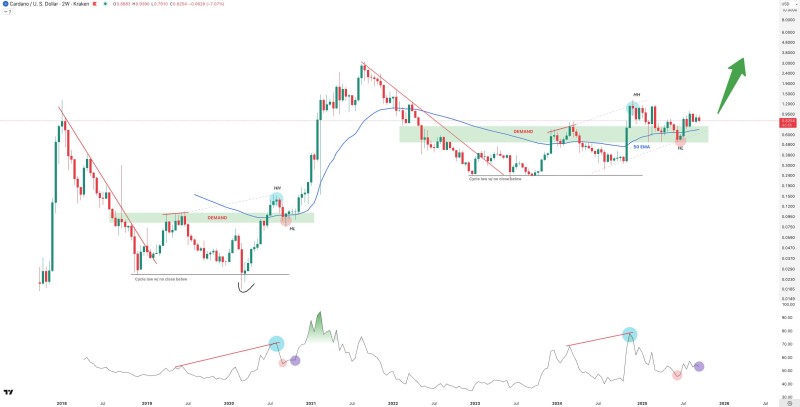
The technical story here is pretty compelling. ADA keeps respecting those green demand zones even when everything else was falling apart - that's serious buyer interest right there. We're seeing higher lows stack up since the cycle bottom, which flips the whole market structure from bearish to bullish. The 50 EMA reclaim is huge too - that moving average basically separates the bulls from the bears, and ADA just crossed back into bull territory.
But here's the kicker: the RSI at the bottom is showing the same divergence pattern we saw before ADA's monster 2020-2021 run. If that's not a signal, I don't know what is.
Why ADA is Building Steam
The fundamentals are lining up nicely. Cardano's ecosystem keeps expanding with new DeFi protocols and stablecoin integrations that actually matter for real utility. Meanwhile, institutional players are still building partnerships and integrations that go way beyond just speculation. And with US inflation cooling off and the Fed potentially cutting rates, risk assets like major altcoins are back on investors' radar.
Right now, $0.95 to $1.00 is the wall ADA needs to break through. Get past that and we're looking at $1.20 as the next stop, which could open up a run toward $2.00-$3.00 range. If this cycle really mirrors the last one, we could see ADA test or even break its all-time highs around $4.00-$5.00.
 Peter Smith


