Sergey Diakov

As CyrilXBT noted, Bitcoin printed a daily close near $67,049, but the broader structure stays constrained — highlighting the gap between short-term recovery and any real macro trend alignment.
The BTC Recovery That Has Yet to Prove Itself
The chart shows Bitcoin attempting to stabilize after a sharp decline, with price now hovering in the mid-$60K range. The recent green candle reflects a short-term bounce rather than a confirmed structural shift.
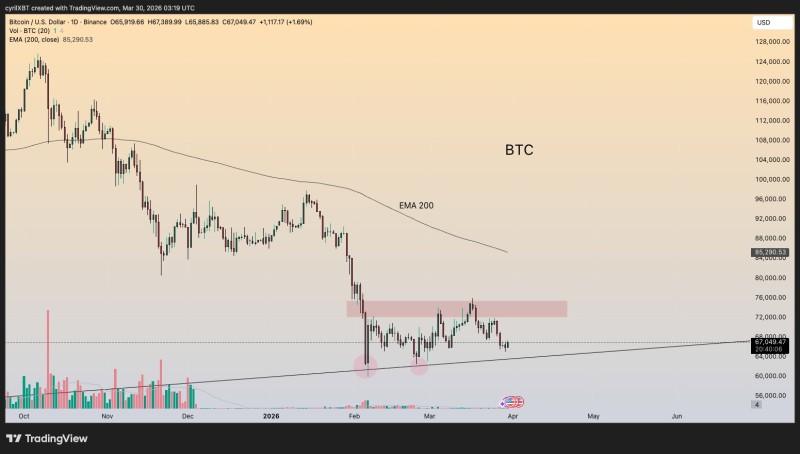
Price remains below the highlighted resistance zone between $72K and $76K. This area previously acted as support but has since flipped into resistance, consistently rejecting upside attempts. The inability to reclaim this zone keeps the current move structurally weak.
A Wide Gap to the 200-Day BTC EMA at $85K
One of the most defining elements on the chart is the 200-day EMA sitting near $85,290 — significantly above current price. Markets trading this far below the 200-day moving average are typically still in a corrective or bearish phase.
The 200-day EMA near $85K isn't just overhead resistance — it's the line that separates correction from trend recovery.
The chart reflects exactly that. Price has not yet shown any attempt to challenge this higher timeframe resistance, reinforcing the disconnect between where Bitcoin trades now and where a bullish trend would begin.
The Trendline Keeping Bitcoin Bears in Check at $64K
While resistance caps upside, BTC Consolidates in Triangle Pattern With Eyes on $72K Breakout shows a rising trendline around $64K continuing to act as support. The chart shows two prior reactions from this level, with price bouncing on each touch. A third test is now approaching, increasing its significance:
- Multiple touches confirm it as a valid structural level
- Each retest weakens support, but also draws more attention
- A breakdown would likely accelerate downside pressure
This aligns with broader technical observations where the $67K–$65K zone acts as a critical support pivot for Bitcoin's short-term structure.
Bitcoin Momentum Still Lacks Confirmation
Despite the recent bounce, the structure continues to show characteristics of a corrective move rather than a reversal. Lower highs remain intact, and price has yet to establish a clean breakout above resistance.
As covered in Bitcoin at $67,700 Support Zone After Breaking Below $72K, the $67K area acts as a key support pivot — and short-term recovery scenarios depend on whether Bitcoin can reclaim nearby resistance, a point reinforced in BTC Price Analysis: Bitcoin Eyes $71,700 on $70,900 Reclaim.
Until Bitcoin reclaims the $70K zone with conviction, every bounce is just a bounce — not a reversal.
For now, Bitcoin remains trapped between a rising support line and a well-defined resistance ceiling. The current move stays unresolved until one side decisively breaks.
 Sergey Diakov