Saad Ullah

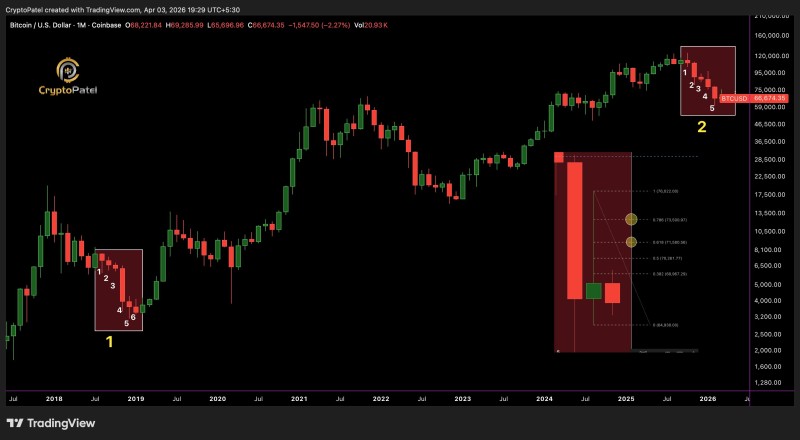
Bitcoin has printed a green monthly close after consecutive red candles, offering a short-term shift in momentum. According to Crypto Patel, one green candle does not change the macro trend - and the chart structure appears to back that view, with price approaching a key Fibonacci retracement zone where liquidity could be targeted before the next move.
Bitcoin's Green Monthly Candle Doesn't Flip the Trend
The chart highlights a repeating structure: a sequence of red monthly candles followed by a brief recovery. In both historical and current cases, the bounce appears within a broader corrective phase rather than signaling a confirmed reversal.
The latest green monthly candle breaks the red streak, but price remains within a structure that still favors downside continuation. Short-term relief, in other words, does not equal a new bull leg.
The macro structure hasn't changed. A single green candle after consecutive monthly losses is a pause, not a pivot.
The $71,580–$73,501 Fibonacci Zone Now in Focus
A key area on the chart is the Fibonacci retracement zone between approximately $71,580 and $73,501, corresponding to the 0.618–0.786 levels. This range is widely associated with liquidity and reaction points in technical analysis - where price tends to stall or reverse.
The chart frames this zone as a potential liquidity grab area rather than a confirmed breakout level. Price may move into this range before determining its next direction. Bitcoin recently struggled below $72K VaH resistance, reinforcing this area as a ceiling rather than a launchpad.
When Bitcoin enters a key Fibonacci zone after a weak bounce, the more likely outcome is a sweep of that liquidity - not a sustained breakout.
The current structure suggests:
- A possible move upward into the 0.618–0.786 retracement zone
- This move acting as a liquidity sweep rather than sustained strength
- Rejection from this area reinforcing bearish continuation
Lower High Structure Still Controls Bitcoin's Direction
Despite the recent bounce, Bitcoin continues to print a corrective structure. The chart's comparison between past and current cycles shows how similar rebounds previously occurred within broader downside phases - not at the beginning of new trends.
BTC recently tested the 50% retracement near $77K before failing to hold above $80K resistance, adding further weight to the lower high narrative. Each bounce has been weaker than the last.
At the same time, key support near $67,700 continues to define the lower boundary of the current structure, with the mid-$60K region remaining a critical zone to watch if selling resumes.
The lower high pattern is the clearest signal right now. Until Bitcoin breaks that sequence, every bounce is guilty until proven innocent.
April Bias Leans Bearish for BTC
The projected path on the chart suggests that after a potential move into the Fibonacci zone, Bitcoin could face renewed downside pressure. The setup leans bearish unless price can reclaim and hold above the $71,580–$73,501 retracement range on a closing basis.
For now, Bitcoin's green monthly close provides a pause in the decline - but the broader structure remains unchanged, keeping downside risk firmly in focus heading into April.
 Saad Ullah