Saad Ullah

Bitcoin continues to trade without clear direction, holding inside a defined range while repeated rejections at key moving averages cap every upside attempt. Analyst Daan Crypto Trades noted that BTC was rejected at these moving averages before being slammed back down, confirming their role in defining short-term direction. The latest chart shows price slipping back toward support, putting the $65K zone in focus as the next critical level to watch.
The $71K-$72K Ceiling That Keeps Rejecting BTC Price
The chart highlights a consistent pattern of rejection near the $71K - $72K range high. Multiple failed pushes into this zone show that buyers have not been able to sustain control at the upper boundary.
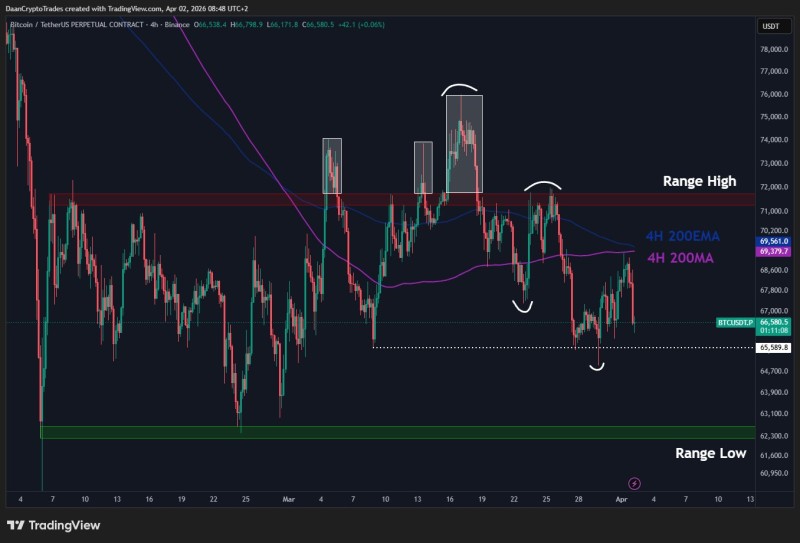
Each of these rejections aligns with the 4-hour 200 EMA and 200 MA, which have acted as resistance over the past few days. Price repeatedly tested this area before being pushed lower, reinforcing it as a firm cap on upside movement.
A BTC Market Stuck in Mid-Range Chop
Price action is concentrated in the mid-to-high $60K region, with no sustained breakout in either direction. The structure reflects a classic range environment, where price rotates between support and resistance without establishing a trend.
Bitcoin Range Builds Below $71K-$72K VaH Resistance - similar range-bound conditions have been observed across recent BTC analysis, with resistance near $71K - $72K consistently capping upside while support continues to form below, reinforcing the current structure.
As long as price stays under those moving averages, the range controls everything - no trend, just rotation between the same levels.
The inability to hold above resistance keeps BTC anchored in this range, while the absence of a breakdown suggests support is still holding - for now.
$65K - The Level That Now Matters Most for Bitcoin
The immediate focus shifts to the $65K area, identified as the next key support level. This zone sits just above the lower boundary of the broader range and represents the first line of defense before any potential move toward range lows.
Bitcoin Price Holds $66K Support Zone as $68K Resistance Tests Begin - nearby support zones in the $66K - $68K region have repeatedly acted as pivot areas, where price either stabilizes or accelerates lower depending on how it reacts.
Key structural elements from the current chart include:
- Clear resistance at $71K - $72K range high
- 4H 200 EMA and 200 MA acting as dynamic resistance
- Continued consolidation in the mid-$60K region
- $65K as the immediate downside support level
If $65K gives way, the next logical destination is the lower range boundary - that's where the real test begins.
A Range That Still Hasn't Broken
Despite multiple rejections and short-term weakness, BTC remains firmly within its established range. Bitcoin Price Analysis: $68,100 Support Seen as Key Bounce Zone Toward $71,700 reinforces how critical these support levels are to the overall structure - a clean break lower would shift the short-term bias considerably.
Until price either reclaims the moving averages or loses $65K, Bitcoin's behavior remains defined by consolidation. The next directional move will likely emerge from this compression, but for now, the chart reflects a market still searching for its next catalyst.
 Saad Ullah