Saad Ullah

Bitcoin is hovering just above a rising support line after failing to sustain higher highs - raising the risk of a breakdown if the structure gives way. A subtle shift is beginning to take shape on the 4-hour chart, and it's one that traders rarely ignore.
As Sky noted, the price action resembles a developing head-and-shoulders pattern, with BTC now pressing directly against neckline support near the $67,500-$68,000 region.
The Pattern That Signals BTC Exhaustion
The structure on the chart reflects a gradual loss of bullish momentum rather than a sudden reversal. Bitcoin first pushed into the $73,000-$74,000 range, forming the left shoulder, before extending higher toward approximately $76,000 to create the head.
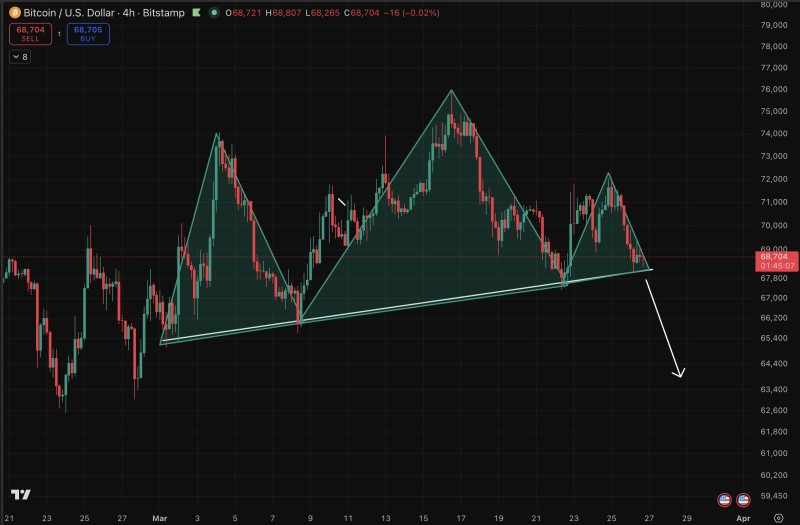
The subsequent rally failed to match that strength, topping out closer to $71,000-$72,000 - marking a lower high and forming the right shoulder.
This sequence is critical. Instead of continuation, the market is printing a classic distribution pattern where each rally attempt weakens.
This is where things get interesting. Similar formations have historically signaled potential trend shifts across crypto markets, with head-and-shoulders structures often preceding downside moves when confirmed.
What makes this setup more nuanced is the shape of the neckline. Rather than flat support, Bitcoin is holding a rising trendline currently sitting near the $67,500-$68,000 region. This line has acted as dynamic support throughout the recent uptrend, consistently producing higher lows - but now price is compressing directly onto it.
That compression matters. Each retest weakens support, especially when accompanied by declining upside momentum. If BTC closes decisively below this rising trendline, it would:
- Break the sequence of higher lows
- Confirm the head-and-shoulders structure
- Open a path toward the $64,000 region
That downside projection aligns with previous consolidation zones where liquidity is likely to be revisited.
Bitcoin's Lower Highs Reveal Fading Demand
The internal structure reinforces the bearish bias. Recent price action shows:
- Rejection at the head near $76,000
- A weaker right shoulder below $72,000
- Slower, less aggressive rebounds from support
Buyers are still defending support, but they are no longer able to reclaim prior highs - an early sign of trend fatigue.
This progression highlights a clear shift in order flow. Comparable technical setups across crypto assets show similar behavior before larger directional moves, where repeated failures at resistance eventually lead to breakdowns.
BTC Market Is Leaning, Not Breaking - Yet
Despite the pressure, the breakdown is not confirmed. Bitcoin remains above its rising trendline, and until that level is decisively lost, the structure remains technically intact. A reclaim of the $70,000-$71,000 region would begin to invalidate the bearish setup and restore short-term bullish momentum.
The longer price holds near support without a strong bounce, the more likely it is that the next move will be decisive.
For now, BTC is in a transitional phase - no longer trending cleanly upward, but not yet breaking down. That tension typically doesn't last long. Traders watching Ethereum face similar risks will recognize the pattern: the clock is ticking.
 Saad Ullah