 Saad Ullah

⬤ BNB/USD is holding a solid bullish structure after breaking out from a minor pullback phase. The 4-hour chart shows buyers pushed through a critical resistance level tied to a corrective wave, signaling fresh upward momentum in the broader trend.
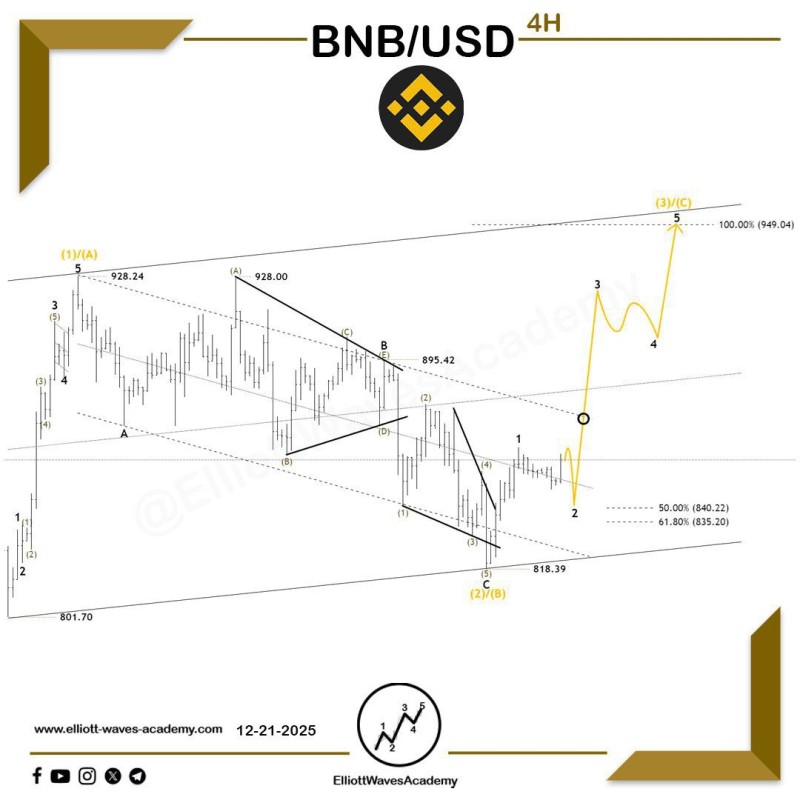
⬤ Price is moving within an upward channel on the 4-hour timeframe, with the correction wrapping up near the lower boundary. The analysis shows BNB continuing its advance in what appears to be wave (3)/(C) — typically a strong continuation phase. Chart projections point to a minimum target above the recent high at $928.24, with an ideal upside zone around $949.04 based on the 100% extension level.
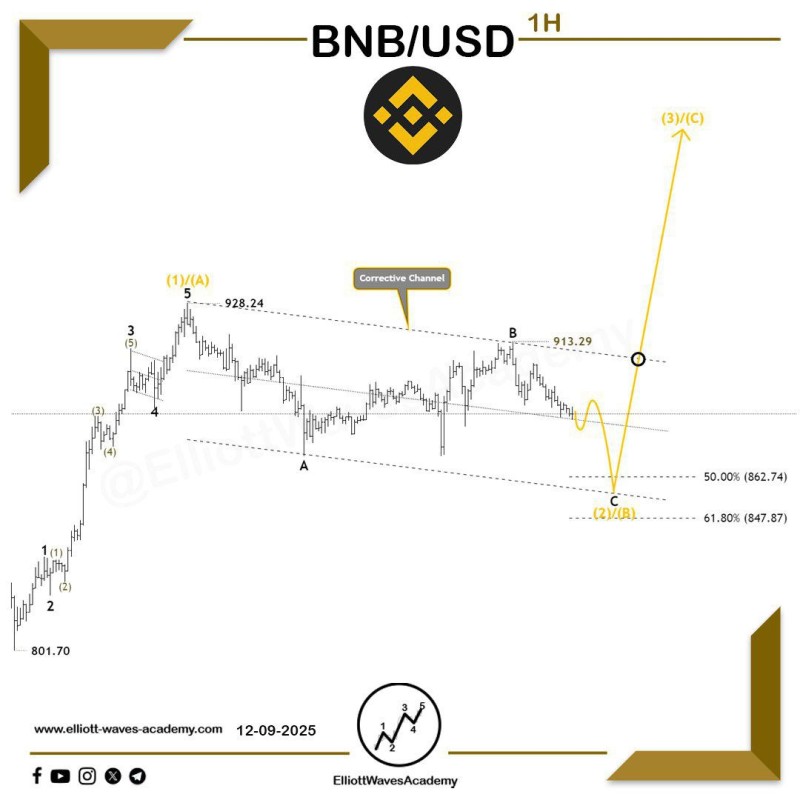
⬤ The 1-hour chart backs up this bullish view. After dipping into a corrective channel, BNB bounced right from the Fibonacci retracement sweet spot between 50% and 61.8%. This reaction shows buyers are defending key support levels, keeping the uptrend alive as smaller sub-waves form higher.
⬤ This setup matters because BNB often moves in sync with broader strength across major digital assets. A clean break above $928 would confirm the current rally is still on track. Further gains depend on price holding above the channel resistance. That said, if BNB can't stay above recently reclaimed levels, we might see another consolidation phase before the next directional move takes shape.
 Saad Ullah


