 Saad Ullah

⬤ Bitcoin is stuck in a tight range, coiling between two converging trend lines on the six-hour chart. Right now, BTC/USDT is sitting around 88,556 USDT—up about 1.51 percent on the session. The chart shows Bitcoin grinding sideways inside a green box while the overall structure forms a textbook symmetrical triangle. It's the kind of setup where the market is getting squeezed tighter and tighter, usually right before something gives.
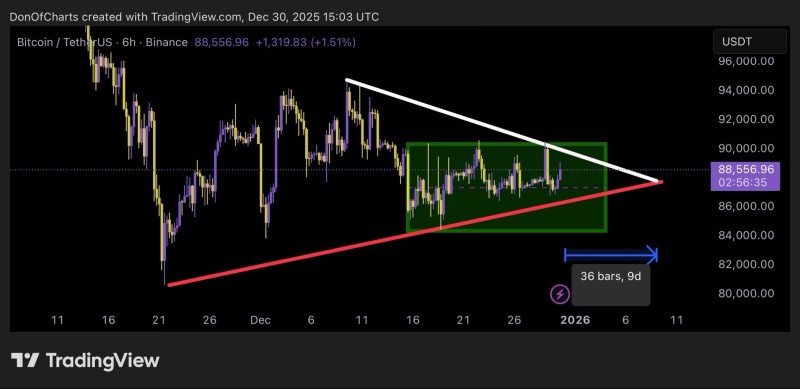
⬤ The triangle's made up of two clean lines: a descending resistance connecting lower highs since early December, and a rising support underneath catching higher lows. There's "motion on BTC," but for now that motion is just back and forth inside an increasingly narrow band. For the past 36 bars—roughly nine days—Bitcoin's been bouncing between support and resistance without committing either way.
⬤ What makes this interesting is that BTC hasn't really tested the extremes lately. The upper boundary around 90,000 USDT? Untouched. The lower zone near 84,000 USDT? Same story. Instead, price keeps drifting back toward the middle of the range, stuck around 88,000 to 89,000 USDT. It's classic consolidation behavior—low volatility, narrow swings, and everyone waiting to see which way it breaks.
⬤ These symmetrical triangles usually resolve with a sharp move once price hits the apex, and Bitcoin's getting close to that point. Whether it breaks up or down is anyone's guess, but the longer this compression lasts, the bigger the eventual move tends to be. For now, the market's in wait-and-see mode as we head into early 2025.
 Saad Ullah


