Victoria Bazir

Bitcoin is back near the upper edge of its trading range, hovering around $70,428 on the hourly chart. The move brings BTC within striking distance of two significant buy-side liquidity clusters — and how price reacts at these levels could set the tone for the next major leg.
$72,846 Buy-Side Liquidity Is the Key Magnet Above the Market
BTC is currently testing range highs where liquidity clusters tend to form. Two zones stand out above the market: one near $71,200 and a stronger concentration around $72,846.
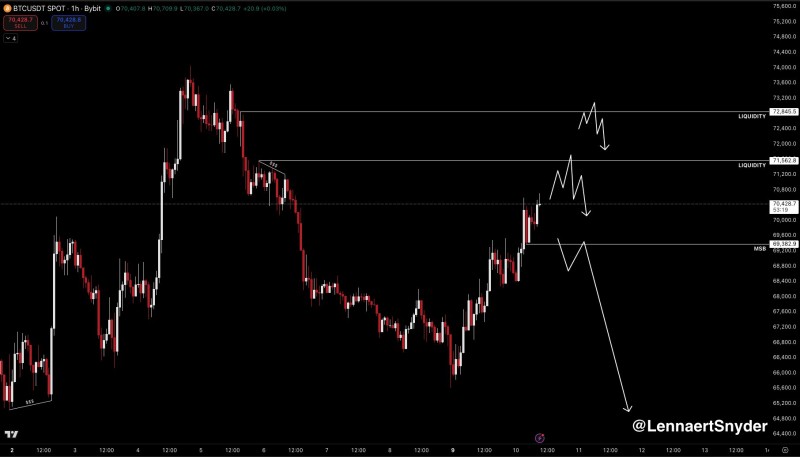
These areas typically hold stop orders and leveraged long positions that can pull price higher before a reversal kicks in. As noted in Bitcoin Eyes $71,745 Liquidity Zone Ahead of NFP Data, clustered orders near resistance often act as magnets during consolidation.
Support at $69,383 Holds the Key — Break Opens Path to $65,280
On the downside, the chart flags a critical structural level at $69,383. A clean break below this support would expose BTC to a deeper pullback toward the $65,280 area — a weaker liquidity zone further down the range. This mirrors the pattern covered in Bitcoin Rejects $68K Range High — What's Next for BTC?, where repeated tests of the upper range led to pullbacks toward lower support.
The overall structure fits a classic liquidity-driven pattern: price sweeps buy-side liquidity above the range before reversing, or breaks down if structural support gives way. As highlighted in Bitcoin Enters New 14-Day Range After 69-Day Consolidation Break, tightening ranges like this one often precede stronger directional moves once liquidity is absorbed. For now, the $69,383 support and the $72,846 liquidity ceiling define the battlefield.
 Victoria Bazir