 Usman Salis

⬤ Bitcoin has settled into a newly-formed trading range after breaking down from a previous zone where it spent 69 days consolidating. The cryptocurrency is now 14 days into this fresh compression phase, moving between clear support and resistance levels. The market appears to be in a holding pattern, gathering momentum before choosing its next direction.
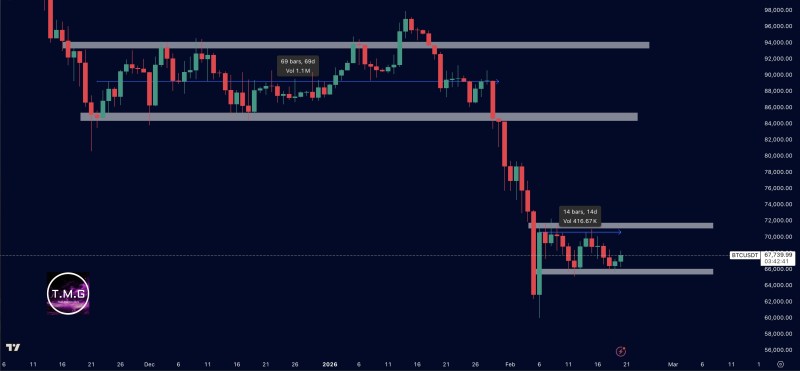
⬤ The chart reveals how BTC held within its earlier range for roughly 69 trading sessions before dropping sharply. After that breakdown, Bitcoin found footing near the mid-$60,000 level, establishing new support. Right now, price is bouncing between approximately $66,000 on the downside and close to $72,000 on the upside. This 14-day range is notably tighter than the previous 69-day base, showing how the market cycles through different phases of compression and expansion.
⬤ Recent technical analysis shows Bitcoin often goes through prolonged pullbacks followed by staged consolidation before any major trend resumes. In BTC Holds $60K Support as Traders Eye $78K Resistance, analysts point out how BTC defended the $60,000 level while eyeing $78,000 as the next resistance target.
As one trader observed, "Extended compressions typically precede significant breakouts as liquidity builds and volatility coils."
Meanwhile, BTC Price Analysis: Bull Flag Holds as $74K Resistance Caps Upside examines how price behavior around $74,000 resistance continues shaping near-term moves. Additionally, BTC Price Analysis: Bitcoin Tests 50% Retracement at $77K Below $80K Resistance explores consolidation patterns beneath key resistance zones.
⬤ This current range phase matters because tight consolidations often lead to explosive moves once price finally breaks out. With two weeks inside this zone, Bitcoin traders are weighing supply and demand dynamics between the mid-$60,000s and low-$70,000s. Whether BTC pushes above resistance or dips below support will likely determine the next major trend across the broader crypto market.
 Usman Salis


