 Sergey Diakov

⬤ Bitcoin's holder behavior has flipped in a meaningful way. After months of steady selling at elevated prices, long-term holders changed course when BTC slid into the $62,000 to $68,000 zone. That's when distribution stopped and fresh accumulation began, a shift that became visible in on-chain data after January 12, 2026. As reported by Coin Bureau.
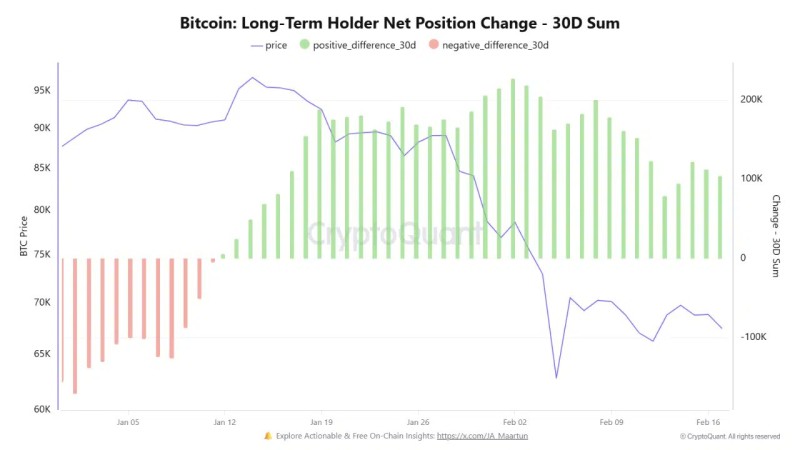
⬤ The long-term holder net position change chart (30-day sum) makes the pivot hard to miss. During the decline from the mid-$90,000s down toward the mid-$60,000s, the bars were consistently negative, reflecting steady distribution. Once price settled lower, those bars flipped positive, signaling that coins were moving back into long-term hands rather than out of them.
Buying into weakness is the pattern on-chain analysts watch for, and right now the data is showing exactly that as losses deepen and distribution fades.
⬤ With net position change now positive, coins appear to be flowing back into long-term holder cohorts rather than hitting the open market. This dynamic is a key signal of accumulation strengthening during price pullbacks, and it often aligns with broader signs of a developing on-chain reversal zone as selling pressure fades and losses deepen.
⬤ Why does this matter? Long-term holder behavior directly shapes available supply during corrections. When these holders slow their selling and start adding again, it tightens the balance between sell-side pressure and stored supply. That's why on-chain watchers track this alongside declining exchange reserves and reduced sell pressure as part of a broader read on market conditions.
 Sergey Diakov


