 Saad Ullah

⬤ Bitcoin is seeing increased activity from accumulation wallets even while prices stumble. According to CW, the current price level sits right where big players started stacking coins back in October 2024. The charts show a clear jump in inflows while BTC trades around that same area, pointing to continued positioning instead of selling.
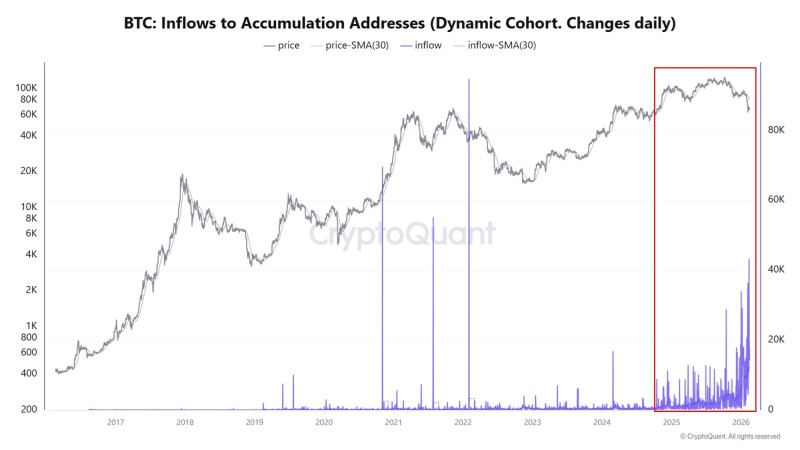
⬤ The numbers show accumulation actually picking up steam during the drop, not slowing down. This kind of pattern typically shows up when long-term holders are quietly scooping up supply while the market moves sideways or corrects. A similar phase followed a bear flag pattern reversal, where the positioning shifted after a downside move played out.
⬤ The data also reveals prices circling back to the exact zone where accumulation kicked off initially, highlighting just how important this range is. The market structure looks more like consolidation than panic selling, especially since inflow growth keeps rolling during pullbacks. We saw comparable demand when ETF inflows returned after withdrawals, showing renewed buying despite shaky confidence.
⬤ This matters because persistent accumulation during falling prices reveals genuine demand hiding beneath the surface action. When coins get quietly absorbed while everyone's nervous, market moves often catch up later to what's already happening behind the scenes — a structural shift unfolding underneath the visible BTC price movement.
 Saad Ullah


