Usman Salis

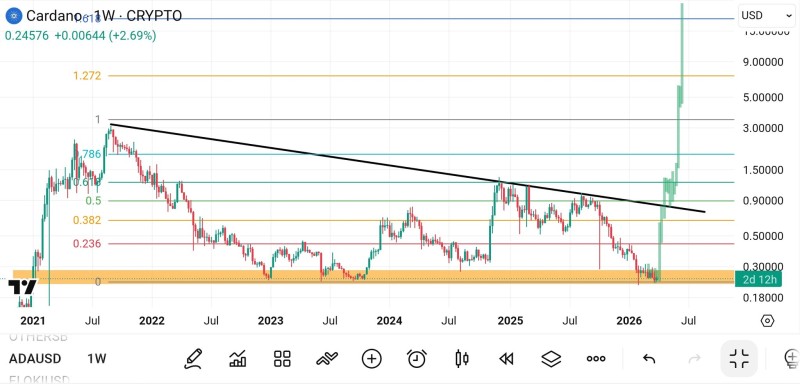
Cardano is moving fast. After spending months grinding near lows around $0.20, price has broken decisively above a long-term descending trendline, flipping structure from bearish to bullish and putting increasingly bold projections back in circulation.
ADA Breaks the Trendline That Defined the Downtrend Since 2021
The chart tells a clean story. Since its 2021 peak, ADA had been trading under a descending resistance line, posting lower highs and finding no sustained strength. That structure is now broken. Price moved decisively through the trendline, shifting the technical picture from prolonged bearish pressure into a fresh breakout phase - originating from a well-established accumulation zone near $0.20, where ADA found support repeatedly before finally launching. XRP CAPTAIN flagged the strength of the move early, noting that the breakout had the profile to trigger a much larger upside run.
The breakout from long-term descending resistance is not a minor development - it represents a structural reset after years of compression.
From Months of Compression to Rapid ADA Price Expansion
What stands out about the current move is the speed. After a prolonged sideways base, ADA shifted almost immediately into vertical expansion - reclaiming multiple levels in a short period that previously took months to give up. Price moved through mid-range reactive zones around $0.38 and $0.50, then pushed toward higher resistance near $0.78 and above. This kind of behavior is typical of a transition from accumulation into momentum-driven expansion, where moves come faster and with less orderly structure. As noted in Cardano (ADA) Eyes $2.00 as Momentum Builds, reclaiming key zones out of extended consolidation tends to sharply accelerate upside potential.
When price emerges from a base this long and this deep, the expansion phase rarely moves in a straight line - but the directional bias is hard to argue with.
ADA Enters Historically Reactive Resistance Between $0.78 and $1.00
Strong breakout or not, ADA is now pushing into territory where prior rallies consistently struggled. The $0.78-$1.00 zone is historically significant - it has acted as a cap on multiple prior moves and is likely to generate friction again. The vertical pace of the current rally also means momentum is outrunning structure, which tends to produce sharp pullbacks even within otherwise bullish phases. How ADA handles this zone will matter. Cardano Holds Crucial Support at 50-Week Moving Average covered exactly this dynamic - how key support and resistance levels continue to shape the next phase depending on whether price holds or fails them.
ADA Parabolic Target of $30 - Speculative, But the Breakout Is Real
Projections toward $30 are circulating - and they remain highly speculative. Nothing on the chart confirms a move of that magnitude. What the chart does confirm is a legitimate structural breakout and a rapid expansion phase following years of compression. That alone is a meaningful development. Cardano Faces Billions in Exchange Outflows adds useful context here - historical accumulation patterns in ADA, particularly when long-term holders keep positioning through weakness, have preceded some of the sharpest directional moves the asset has seen.
The $0.20 base represented years of distribution and re-accumulation. Breaking out of that level decisively is the kind of shift that changes how the whole chart reads.
The breakout has happened. The structure has shifted. The real question now is how far this expansion phase runs before ADA meets resistance strong enough to slow it down.
 Usman Salis