 Eseandre Mordi

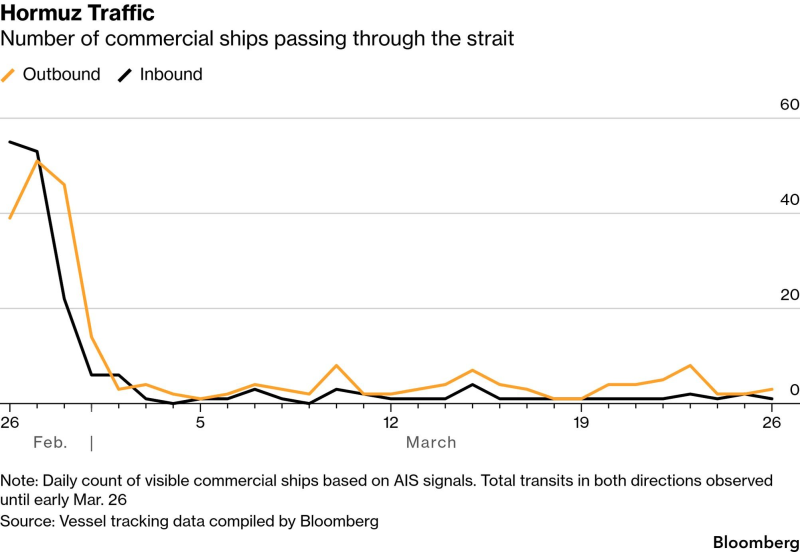
This isn't an oil rally driven by positioning or sentiment. It's driven by something you can count: ships. Tanker traffic through the Strait of Hormuz has gone from 40 to 50 vessels per day down to almost nothing, and the chart showing that collapse is now the most important data point in global oil markets.
Walter Bloomberg flagged the shipping data alongside the price move, and the two charts together make the case that this repricing is tied to observable physical disruption, not just fear.
Hormuz Tanker Traffic Drops From 50 Ships Per Day to Near Zero, WTI and Brent Reprice Fast
The chart shows both inbound and outbound vessel flows falling almost vertically before flattening near zero throughout March. Inbound traffic drops from above 50 vessels to nearly nothing. Outbound follows shortly after. Neither recovers.
Supply is tightening rapidly as disruption persists. The collapse in tanker movement is transforming a headline-driven move into a sustained supply constraint. - Walter Bloomberg
That persistence is the key signal. A single-day drop in traffic reads as noise. A flatline at near-zero across weeks reads as a structural constraint. The market is pricing the latter, which is why Brent has already topped $100 with the Hormuz closure putting roughly 20% of global supply at risk.
The Strait of Hormuz carries an outsized share of global seaborne oil. When transit through it effectively stops, the impact isn't limited to missing barrels. It includes delivery delays, costly rerouting, and cascading inefficiencies that ripple through the entire supply chain.
WTI Crude Oil Spike to $96 Reflects Physical Logistics Breakdown, Not Just Sentiment
The distinction between sentiment-driven moves and logistics-driven moves matters for how long a rally holds. Sentiment fades when headlines cool. Physical constraints hold until the underlying flow problem resolves.
The key signal is not the initial decline but the failure to recover. When flows collapse and stabilize at extremely low levels instead of rebounding, the system remains constrained.
WTI has already been flagged in scenarios targeting $110 to $120 as the Hormuz closure scenario develops, with the forward curve signaling that markets are taking the duration of this disruption seriously rather than assuming a quick normalization.
The absence of any traffic recovery through mid-to-late March is what keeps that scenario relevant. Every day the flatline holds, the case for sustained higher prices strengthens.
Saudi Rerouting Through Yanbu Offers Partial Bypass but Doesn't Normalize Global Oil Flow
The market response to Hormuz disruption isn't purely passive. Producers are adapting. Saudi Arabia has surged exports to 4.19 million barrels per day through Yanbu, rerouting shipments to bypass the chokepoint entirely. That's a meaningful offset, but it doesn't restore the full volume that was moving through Hormuz before traffic collapsed.
That shift in what the market is watching is itself significant. When traders move from pricing headlines to pricing flow data, the feedback loop between physical disruption and market levels becomes more direct and more persistent. A diplomatic development can reverse a sentiment-driven move overnight. Restoring 40 to 50 ships per day of tanker traffic through a contested strait takes longer.
Brent near $111 and WTI above $96 are where the math lands when you remove a meaningful portion of global seaborne oil supply and the alternative routes can only partially compensate. The chart showing near-zero traffic is the reason those numbers are holding.
 Eseandre Mordi


